COVID-19 Vaccine Program Eliminates Law Enforcement Workforce Infections: A Bayesian Structural Time Series Analysis
Abstract
COVID-19 has created tremendous operational difficulties for law enforcement agencies, with substantial portions of their staff quarantined for either exposure or infection. With the rollout of a vaccine beginning in early 2021, there is hoped for relief on the horizon. However, to date, no study has reported the vaccine’seffect on infection rates within the law enforcement workforce. We address that gap with a report on a single large agency’s experience, using data on officer positivity rates gathered over 341 days. During the immunization period, employees accepted vaccination at over 70% uptake. Results show the vaccine eliminated new cases of COVID-19 among the agency’s nearly 700 employees within weeks. As other agencies consider their vaccination programs, they should consider communicating early and often about the impact of the pandemic on operations and the efficacy of vaccination, including the results reported here.
Important links
- Published version available at Police Practice and Research https://doi.org/10.1080/15614263.2021.1894937
- Download post-print here
Introduction
The COVID-19 pandemic is a public health emergency that has drawn on for an extended period. The pandemic has infected over one hundred million individuals and killed over two million worldwide. Police officers are not immune to these adverse outcomes, with 221 law enforcement deaths in the U.S. attributed to the virus in 2020 alone. The death toll from COVID-19 accounts for 65% of all U.S. law enforcement deaths in 2020 and is five times the number of officer deaths from gunfire (ODMP, 2021). As of October 2020, nearly 6,000 members of the New York City Police Department had tested positive for COVID-19, and 46 members had died (Eyewitness News, 2020). As of January 2021, over 500 members of the Detroit Police Department had tested positive for COVID-19, including the Chief of Police. The department reports losing approximately 20,000 working days during the pandemic due to officer quarantines (Abdel-Baqui, 2021).
The stark realities of the pandemic’s effect on law enforcement have necessitated operational changes for police agencies. These challenges and changes are exacerbated because of the heightened risk of exposure for police officers due to their frequent close contact with members of the public (Jennings & Perez, 2020). With no blueprint on managing operations in a pandemic, police agencies have had to make frequent changes in uncertain circumstances (Jones, 2020). Some of these changes have included suspending training and roll calls, limiting access to department facilities, suspending community outreach initiatives, and transitioning employees to telecommuting when possible (Jennings & Perez, 2020). Further, many agencies report limiting proactive traffic and pedestrian stops and responding remotely (i.e., telephone, internet, videoconference) to some calls-for-service (Lum et al., 2020a, 2020b).
Law enforcement agencies have had to adopt a medical approach, acquiring and (hopefully) implementing epidemiologists’ advice on slowing the virus’s spread within their agencies (Jones, 2020). This advice has included the expanded use of personal protective equipment (PPE), such as N95 masks, gloves, disinfectant use, and rigorous decontamination procedures upon exposure (Centers for Disease Control, 2020; Simpson & Sandrin, 2021). Even with these precautions, police agencies have experienced severe staffing shortages due to illness and prophylactic quarantines (Abdel-Baqui, 2021; Eyewitness News, 2020; Stone, 2021). It has been suggested that these pandemic-related staffing shortages may be linked to fewer homicides being solved (Calvert & Elinson, 2020), increased violent crime (Abdel-Baqui, 2021; Rosenfeld & Lopez, 2020), and mental and operational fatigue (Jiang, 2020). Compounding these struggles are increases in domestic violence cases, themselves associated with pandemic-related stay-at-home orders (Leslie & Wilson, 2020; Nix & Richards, 2021).
A diminished workforce has been identified as a primary obstacle to policing during a pandemic. Absenteeism places additional stress on the remaining available officers, impacts performance, and adds further stress on remaining officers (Laufs & Waseem, 2020). With the impossibility of removing all risks for infection and continued demand for public engagement (Nix et al., 2021), the only apparent long-term solution is widespread vaccinations within police agencies. However, with the combination of the newness of the COVID-19 vaccines, the rapid manner in which they were developed and distributed, the reluctance of most agencies to mandate vaccination (PERF, 2021a), and many agencies facing the specter of low vaccination rates within their organizations (PERF, 2021a; Rector, 2021), it is still unclear how much of an effect the rollout of COVID-19 vaccines will have on law enforcement workforces.
With the reported efficacy rates of the first two vaccines being distributed—approximately 95% (Branswell, 2021)—the expectation is substantial decreases in infection rate within a department upon widespread vaccination. However, as police officers are at a particularly heightened risk of exposure (Jennings & Perez, 2020) and perhaps more reluctant to undergo vaccination voluntarily (Rector, 2021), ultimately, this remains an empirical question. We examine vaccines’ effect on a police population in one large police department in the western U.S., providing an early investigation into the causal link between agency-level vaccinations and infection rates.
Data and Methods
We obtained daily infection case data from the Salt Lake City Police Department (SLCPD). The data was collected beginning March 9, 2020, and continued through February 12, 2021, for a total of 341 time-series data points. The SLCPD is authorized 691 employees. Over the studied time period, the total number of employees fluctuated between 600 and 691 due to resignations, retirements, and hiring of new personnel. Throughout the studied period, the agency had 85 positive tests, equating to 12% of its authorized workforce.
The state of Utah began the first phase of its vaccination program in early December 2020. The initial phase provided for the vaccination of hospital healthcare workers, long-term care facility residents and staff, non-hospital healthcare workers, and public health and tribal health care workers. The second part of Utah’s initial vaccination phase included law enforcement officers and K-12 teachers. Utah primarily used local health departments for vaccination administration. The SLCPD is situated in Salt Lake County. The county’s health department began providing vaccinations to law enforcement staff on January 6, 2021. Given the impact and importance of civilian staff on law enforcement agency operations (Adams & Mastracci, 2020), both sworn and non-sworn staff were included in the vaccination program. Slightly more than 70% of all SLCPD police department employees received a first vaccination over four days.1
To analyze the vaccination program’s effect on SLCPD’s infection rate, we estimate a Bayesian Structural Time Series (BSTS) model2. We leverage the model to conduct a causal impact analysis (Brodersen et al., 2015). When a series of measures are broken up by introducing an intervention that occurs at a specific point in time, time-series analysis is appropriate (Shadish et al., 2002). Both the Moderna and Pfizer vaccines were used during the police officer vaccinations (Baden et al., 2021; Polack et al., 2020). Both vaccines require two doses. The interval between Moderna doses is 28 days, and 21 days for the Pfizer vaccine (Branswell, 2021). Even with employees receiving the required second doses in the following weeks, it is reported that the Pfizer vaccine is approximately 52% effective after the first dose, and the Moderna vaccine is approximately 80% effective after the first dose (Gorvett, 2021). However, more recent evidence indicates that just an initial vaccine dose alone is approximately 92% effective for both vaccines (Skowronski & De Serres, 2021). Accordingly, the intervention date in the analysis is January 6, 2021 (i.e., the first day of vaccinations), resulting in 303 pre-intervention data points and 38 post-intervention data points.
A cursory review of the data appears to indicate that vaccinations did affect the agency’s infection rate. As observed in Figure 1, a rapid decline in the seven-day rolling average infection rate per 100 employees occurred immediately following the vaccine intervention point. Within weeks, the seven-day average fell to zero, eliminating the impact of infections among agency personnel.
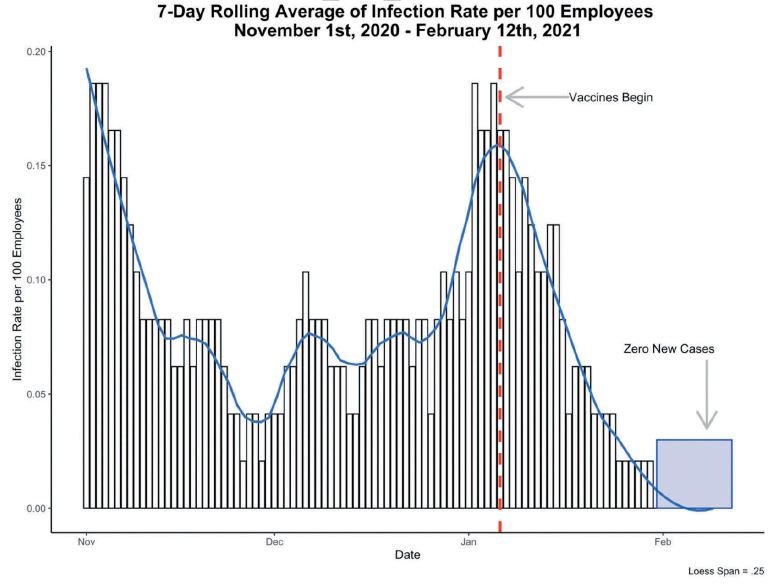
Figure 1. 7-Day Rolling Average of Infection Rate per 100 Employees November 1st, 2020 – February 12th, 2021.
However, this uncontrolled analysis cannot judge whether the observed change is significantly different from what we would have expected if vaccinations had not occurred. Infection rates have ebbed and flowed during the pandemic during various ‘surges.’ As an overall decrease in positive cases was experienced within the state while the agency rate plummeted, it may be the observed reduction was not causally related to the vaccination program at SLCPD. For a more robust assessment of the impact of vaccinations on the agency infection rate, we turn to the BSTS model.
Causal Inference
BSTS models are used to infer causal impact by predicting the counterfactual treatment response in a synthetic control that would have occurred if no intervention had taken place. The synthetic control is constructed using the experimental group’s time-series behavior before and after the intervention and combining control variables predictive of the target series before the intervention (Mourtgos et al., 2021). A key component of utilizing BSTS models for causal impact analysis is the identification of predictors. Predictors are regressed onto the observed values, creating the composite synthetic control series.
A police department is a microcosm of its surrounding communities. Accordingly, its COVID-19 infection rate should generally follow similar patterns as the city, county, and state where it is situated. To assess this logic’s soundness, Figure 2 plots the seven-day rolling average infection rate per 100 persons for SLCPD, Salt Lake City, Salt Lake County, and the state of Utah from March 9, 2020, through January 5, 2021 (i.e., the pre-intervention period). As shown, the infection rate closely tracks the infection rate of these different community levels, though a noticeably higher rate of infection among SLCPD employees compared to the underlying community is detectable beginning in late summer 2020. Importantly, if vaccination of almost three-quarters of the police department had a significant effect on its infection rate, we would not expect to see a similar drop in these other three measures, as the vast majority of individuals in these larger communities were not being vaccinated during the same period. As such, the concurrent city, county, and state infection rates are employed as control variables in the synthetic model.
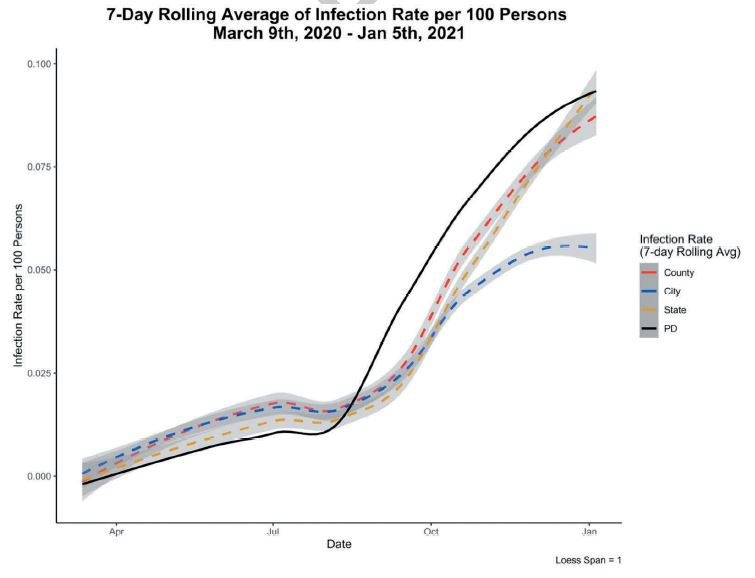
Figure 2. 7-Day Rolling Average of Infection Rate per 100 Persons March 9th, 2020 – Jan 5th, 2021.
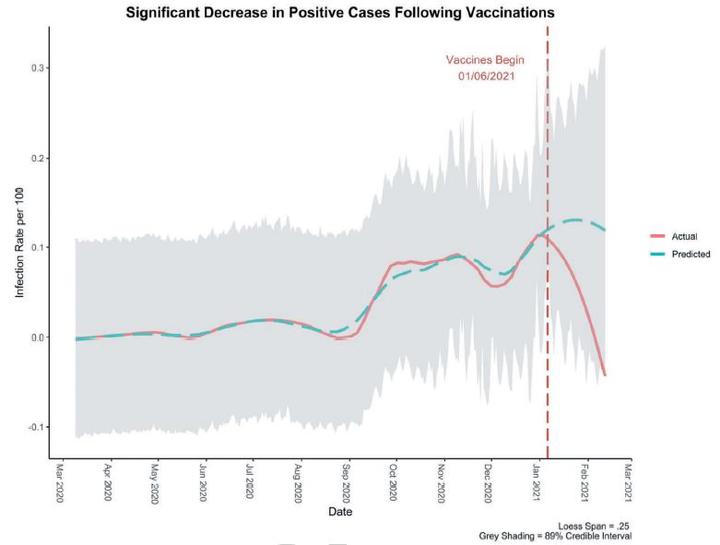
A BSTS model was estimated for the department’s infection rate. The model makes probabilistic estimations of what the department’s infection rate ‘should’ have been without the vaccination intervention. These probabilistic estimations are based on the department’s infection rate prior to vaccinations and its statistical relationship with the surrounding communities’ infection rates3. This allows us to compare the department’s infection rate following the vaccination intervention with what we would have expected it to be without the vaccination intervention. Results for the model assessing change in the infection rate are presented in Figure 3.
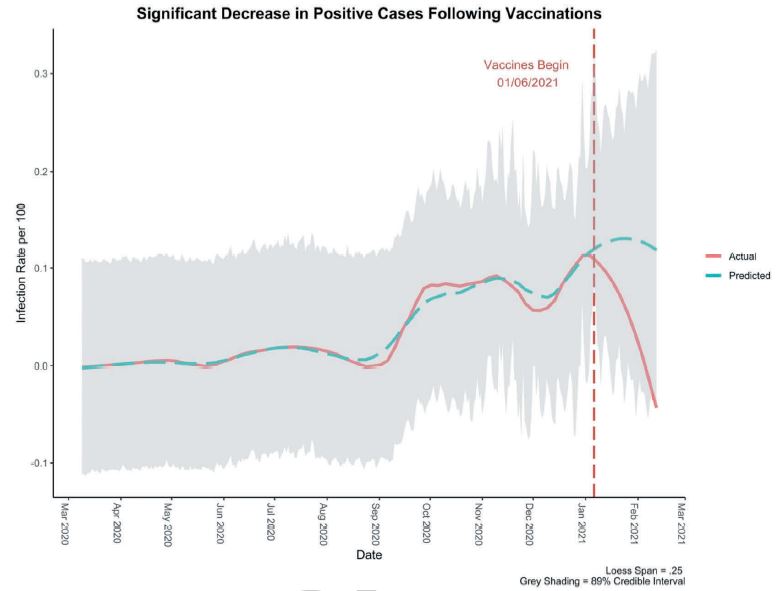
Figure 3. Significant Decrease in Positive Cases Following Vaccinations.
Table 1 demonstrates the vaccinations are associated with decreased COVID-19 infection rates at the studied police department. During the post-vaccination period, the average infection rate per 100 was 0.043. By contrast, in the absence of vaccinations, a counterfactual average infection rate of 0.127 per 100 would be expected. Subtracting this prediction from the observed response yields an estimate of the vaccinations’ absolute causal effect on the COVID-19 infection rate per 100 employees (-0.084), resulting in a 66% relative decrease in the infection rate. The posterior probability of the observed effect is .95. In other words, there is a very high probability that the vaccinations reduced the COVID-19 infection rate at the studied police department.
Note that in Figure 3, the synthetic model also predicts a declining infection rate. This predicted trend demonstrates the estimated model’s credibility, as a natural decrease in SLCPD’s surrounding communities was observed around the same period. However, the police department’s vaccinations depressed the infection rate (to zero) much quicker than would have otherwise been expected in the counterfactual scenario.
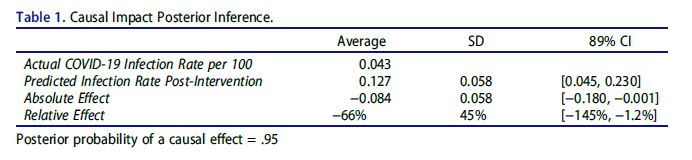
Table 1. Causal Impact Posterior Inference.
Discussion
The COVID-19 pandemic has posed significant obstacles to policing. One of the most challenging pandemic outcomes has been keeping police department workforce levels operationally viable (Abdel-Baqui, 2021). The above analysis shows that vaccinating a large percentage of a police agency can help protect its employees and allow for adequate operational staffing. A vaccination program at the studied agency is associated with a rapid decrease of infections among employees, effectively eliminating the pandemic’s effect on staffing.
Rapidly documenting and communicating these findings are especially important during a period where a policing ‘workforce crisis’ has already been identified (PERF, 2019). While this may seem to be a fairly obvious solution to the problems the pandemic is causing law enforcement agencies, we hope that empirically documenting this result within a police agency will 1) help encourage officers in other agencies to get vaccinated, and 2) support agencies in making intensive efforts to boost staff vaccination rates.
Before encouraging officers to take advantage of the vaccine, however, agencies must have access to it. Reporting indicates that access has proven more difficult in some areas than what the studied agency experienced. Delayed access to vaccines for police officers has been reported in many areas, including Ohio (Halperin, 2021), California (Cain, 2021; Gotfredson, 2021), and New York (NBC New York, 2021). Logistical delays may not be the only hindrance to a well-vaccinated law enforcement workforce. Internal surveys at several agencies have reported that their workforce intends to receive the vaccine at a much lower rate than that observed at SLCPD. These estimates range from 33% to 60% (PERF, 2021a; Rector, 2021). Low vaccination rates could prove problematic as it is estimated that at least 70% of a population needs to be immune to create herd immunity (Mayo Clinic, 2021).
Most police agencies are not mandating vaccination (PERF, 2021a). Though likely legal and effective, mandatory vaccinations are controversial and raise a host of ethical concerns (Dubov & Phung, 2015). Even when forced vaccination is legal, it is suggested that mandated compliance increases resistance within a workforce (Laufs & Waseem, 2020). Instead, education and modeling are advocated. The Los Angeles Fire Department recognized hesitancy within their organization regarding the vaccine. To encourage firefighters to take advantage of the vaccine, the Chief regularly disseminated charts and data regarding the pandemic’s effect on the organization and its staff. Further, the Chief publicly received the vaccine when it was available, along with the organization’s two union presidents. As a result, similar to the studied police department, the Los Angeles Fire Department also achieved approximately 70% of its employees being vaccinated (PERF, 2021b).
Interestingly, the studied police department mirrored the Los Angeles Fire Department in its vaccination strategy. A captain was appointed in mid-2020 to oversee SLCPD’s internal COVID-19 response. The captain sent weekly updates with information and charts explaining the pandemic’s effect on its workforce. As the vaccination plan was contemplated, the vaccine’s efficacy and safety were regularly communicated to staff in both written and in-person formats. The statewide law enforcement labor organization communicated early support for the program, taking a positive stance towards vaccination in mid-December 2020. Further, the Chief of Police made his vaccination experience public.
While outside the scope of this study to recommend a specific course of action for agencies to follow in their vaccination programs, we view the reported results as providing two mainline takeaways. First, COVID-19 vaccines work. Second, access to, and widespread uptake of, COVID-19 vaccines is necessary. Agency and labor organization leadership can play an essential role in driving the voluntary vaccination rate towards levels that support herd immunity. As this study demonstrates, high vaccination rates can allow an agency to recover swiftly, with new COVID-19 infection rates among staff at or near zero. Recent evidence indicates that just one dose of the vaccines are ~92% effective (Skowronski & De Serres, 2021). The findings presented here make it clear that there are significant positive effects for both the agency and its workforce from widespread vaccination. As the vaccine becomes more widely available, non-first responder public agencies should begin early efforts similar to those reported here to best prepare their staff.
Future research should attempt to replicate our findings while considering what factors contribute to varying voluntary vaccination rates within law enforcement and other first responder populations. There are continuing, but thus far unresolved, questions regarding whether COVID-19 will become endemic (Hernandez & Hinshaw, 2021), while variants in the disease also raise the possibility that current vaccination regimes will prove insufficient (Centers for Disease Control, 2021). To that point, at this time we cannot know the efficacy of the COVID-19 vaccines over longer periods. By documenting the results of vaccination programs in the many varied contexts of US law enforcement today, scholars can contribute towards a knowledge base addressing ongoing and future epidemiological threats.
References
Abdel-Baqui, O. (2021, January 6). Detroit sees sharp increase in homicides, shootings in 2020. Detroit Free Press.
Adams, I. T., & Mastracci, S. H. (2020). Contrasting emotional labor and burnout in civilian and sworn law enforcement personnel. Policing: An International Journal, 43(2), 314–329. https://doi.org/10.1108/PIJPSM-06-2019-0094
Baden, L. R., El Sahly, H. M., Essink, B., Kotloff, K., Frey, S., Novak, R., Diemert, D., Spector, S. A., Rouphael, N., Creech, C. B., McGettigan, J., Khetan, S., Segall, N., Solis, J., Brosz, A., Fierro, C., Schwartz, H., Neuzil, K.,
Corey, L., … Zaks, T. (2021). Efficacy and Safety of the mRNA-1273 SARS-CoV-2 Vaccine. New England Journal of Medicine, 384(5), 403–416. https://doi.org/10.1056/NEJMoa2035389
Branswell, H. (2021, February 2). Comparing three Covid-19 vaccines: Pfizer, Moderna, J&J. Statnews. https://www.statnews.com/2021/02/02/comparing-the-covid-19-vaccines-developed-by-pfizer-moderna-and-johnson-johnson/
Brodersen, K. H., Gallusser, F., Koehler, J., Remy, N., & Scott, S. L. (2015). Inferring causal impact using bayesian structural time-series models. Annals of Applied Statistics, 9(1), 247–274. https://doi.org/10.1214/14-AOAS788
Cain, J. (2021, January 26). Thousands of LAPD officers waiting to get vaccinated; chief says supply is ‘severely’ limited. Daily News. https://www.dailynews.com/2021/01/26/thousands-of-lapd-officers-waiting-to-get-vaccinated-chief-says-supply-is-severely-limited
Calvert, S., & Elinson, Z. (2020, December 26). Police are solving fewer murders during Covid-19 pandemic. Wall Street Journal. https://www.wsj.com/articles/police-are-solving-fewer-murders-during-covid-19-pandemic-11608994800
Centers for Disease Control. (2020). What law enforcement personnel need to know about coronavirus disease 2019 (COVID-19). Center for Disease Control and Prevention. https://www.cdc.gov/coronavirus/2019-ncov/downloads/guidance-law-enforcement.pdf
Centers for Disease Control. (2021, February 11). New Variants of the Virus that Causes COVID-19 [Government]. Centers for Disease Control and Prevention. https://www.cdc.gov/coronavirus/2019-ncov/transmission/variant.html
Dubov, A., & Phung, C. (2015). Nudges or mandates? The ethics of mandatory flu vaccination. Vaccine, 33(22), 2530–2535. https://doi.org/10.1016/j.vaccine.2015.03.048
Eyewitness News. (2020, October 8). NYPD sees uptick of suspected COVID-19 cases in October. ABC7 New York. https://abc7ny.com/6873406/
Gorvett, Z. (2021, January 14). How effective is a single vaccine dose against Covid-19? BBC. https://www.bbc.com/future/article/20210114-covid-19-how-effective-is-a-single-vaccine-dose
Gotfredson, D. (2021, February 8). When will police officers get vaccinated in San Diego County? CBS8.Com. https://www.cbs8.com/article/news/health/coronavirus/vaccine/police-vaccinated-san-diego/509-85cfcc83-639a-4d5d-aa8e-13fbee24867c
Halperin, E. (2021, February 10). Call for COVID-19 vaccines for law enforcement growing in central Ohio. NBC4 WCMH-TV. https://www.nbc4i.com/community/health/coronavirus/call-for-covid-19-vaccines-for-law-enforcement-growing-in-central-ohio/
Hernandez, D., & Hinshaw, D. (2021, February 7). As Covid-19 Vaccines Raise Hope, Cold Reality Dawns That Illness Is Likely Here to Stay. Wall Street Journal. https://www.wsj.com/articles/as-vaccines-raise-hope-cold-reality-dawns-covid-19-is-likely-here-to-stay-11612693803
Jennings, W. G., & Perez, N. M. (2020). The Immediate Impact of COVID-19 on Law Enforcement in the United States. American Journal of Criminal Justice, 1–12. https://doi.org/10.1007/s12103-020-09536-2
Jiang, Q. (2020). Stress response of police officers during COVID-19: A moderated mediation model. Journal of Investigative Psychology and Offender Profiling. https://doi.org/10.1002/jip.1569
Jones, D. J. (2020). The Potential Impacts of Pandemic Policing on Police Legitimacy: Planning Past the COVID-19 Crisis. Policing: A Journal of Policy and Practice, 14(3), 579–586. https://doi.org/10.1093/police/paaa026
Laufs, J., & Waseem, Z. (2020). Policing in pandemics: A systematic review and best practices for police response to COVID-19. International Journal of Disaster Risk Reduction, 51, 101812. https://doi.org/10.1016/j.ijdrr.2020.101812
Leslie, E., & Wilson, R. (2020). Sheltering in Place and Domestic Violence: Evidence from Calls for Service during COVID-19. 38.
Lum, C., Maupin, C., & Stoltz, M. (2020a). The impact of COVID-19 on law enforcement agencies (Wave 1). Center for Evidence-Based Crime Policy. https://www.theiacp.org/sites/default/files/IACP-GMU%20Survey.pdf
Lum, C., Maupin, C., & Stoltz, M. (2020b). The impact of COVID-19 on law enforcement agencies (Wave 2). Center for Evidence-Based Crime Policy. https://www.theiacp.org/sites/default/files/IACP_Covid_Impact_Wave2.pdf
Mayo Clinic. (2021). Herd immunity and COVID-19 (coronavirus): What you need to know. Mayo Clinic. https://www.mayoclinic.org/diseases-conditions/coronavirus/in-depth/herd-immunity-and-coronavirus/art-20486808
Mourtgos, S. M., Adams, I. T., Nix, J., & Richards, T. N. (2021). Mandatory sexual assault kit testing policies and arrest trends: A natural experiment. Justice Evaluation Journal. https://doi.org/10.1080/24751979.2021.1881410
NBC New York. (2021, January 7). ‘Stand Back:’ NYC Mayor Rips Cuomo on NYPD Vaccines, State Sets Single-Day Case Record. NBC New York. https://www.nbcnewyork.com/news/coronavirus/cuomo-denies-nypd-eligible-for-vaccine-as-feud-with-mayor-continues/2817034/
Nix, J., Ivanov, S., & Pickett, J. T. (2021). What Does the Public Want Police to Do During Pandemics? A national experiment. Criminology & Public Policy. https://doi.org/10.1111/1745-9133.12535
Nix, J., & Richards, T. N. (2021). The immediate and long-term effects of COVID-19 stay-at-home orders on domestic violence calls for service across six U.S. jurisdictions. Police Practice and Research, 1–9. https://doi.org/10.1080/15614263.2021.1883018
ODMP. (2021). Law Enforcement Line of Duty Deaths in 2020. Officer Down Memorial Page. https://www.odmp.org/search/year?year=2020
PERF. (2019). The workforce crisis, and what police agencies are doing about it. Police Executive Research Foundation. https://www.policeforum.org/assets/WorkforceCrisis.pdf
PERF. (2021a, January 19). PERF Daily COVID-19 Report. Police Executive Research Form. https://www.policeforum.org/covid19jan21
PERF. (2021b, February 19). PERF Daily COVID-19 Report. Police Executive Research Form. https://www.policeforum.org/covid4feb21
Polack, F. P., Thomas, S. J., Kitchin, N., Absalon, J., Gurtman, A., Lockhart, S., Perez, J. L., Pérez Marc, G., Moreira, E. D., Zerbini, C., Bailey, R., Swanson, K. A., Roychoudhury, S., Koury, K., Li, P., Kalina, W. V., Cooper, D., Frenck, R. W., Hammitt, L. L., … Gruber, W. C. (2020). Safety and Efficacy of the BNT162b2 mRNA Covid-19 Vaccine. New England Journal of Medicine, 383(27), 2603–2615. https://doi.org/10.1056/NEJMoa2034577
Rector, K. (2021, January 5). Only 60% of LAPD officers, employees willing to take COVID vaccine, internal survey shows. Los Angeles Times. https://www.latimes.com/california/story/2021-01-05/only-60-percent-lapd-employees-want-covid-vaccine-internal-survey
Rosenfeld, R., & Lopez, E. (2020). Pandemic, social unrest, and crime in U.S. cities.
Scott, S. L. (2017, July 11). Fitting Bayesian structural time series with the bsts R package. The Unofficial Google Data Science Blog. https://www.unofficialgoogledatascience.com/2017/07/fitting-bayesian-structural-time-series.html
Shadish, W. R., Cook, T. D., & Campbell, D. T. (2002). Quasi-experiments: Interrupted time-series designs. Experimental and quasi-experimental designs for generalized causal inference.
Simpson, R., & Sandrin, R. (2021). The use of personal protective equipment (PPE) by police during a public health crisis: An experimental test of public perception. Journal of Experimental Criminology. https://doi.org/10.1007/s11292-020-09451-w
Skowronski, D., & De Serres, G. (2021). Safety and Efficacy of the BNT162b2 mRNA Covid-19 Vaccine. New England Journal of Medicine, 0(0), null. https://doi.org/10.1056/NEJMc2036242
Stone, J. R. (2021, January 22). No COVID-19 vaccine for officers, deputies in Alameda County as violent crime surges. ABC7 San Francisco. https://abc7news.com/9893744/
The Salt Lake County Health Department provided several vaccination sessions after the initial vaccinations for those who did not receive the vaccine originally. At the completion of these make-up sessions, approximately 75% of the Salt Lake City Police Department’s workforce was vaccinated. If the number of employees who acquired a level of natural immunity from infection, but did not receive the vaccine, are included, the percentage of the workforce that has some level of immunity is nearly 80%.↩︎
Bayesian Structural Time Series modeling was chosen over the more common ARIMA method for a number of reasons. First, BSTS models are flexible and modular. This allows for researchers to determine the structure of the model by considering whether and how to include regressors, whether short- or long-term predictions are more important, and whether seasonal model components are necessary (Scott, 2017). Further, by working in a Bayesian framework, investigators can better acknowledge and incorporate uncertainty into statistical models and discuss outcomes in terms of probabilities, which tend to be more intuitive.↩︎
The BSTS model was estimated with a local linear trend state component and a regression component for the control variables with spike-and-slab priors over coefficients. Ten thousand Markov Chain Monte Carlo (MCMC) samples were drawn, with 89% posterior distribution credible intervals generated.↩︎