Analyzing Police Violence in America: Updated Data Through 2025
Static Visualizations from Mapping Police Violence Database
Important Data Limitations
This post presents data on police killings, which represents only a subset of all police uses of lethal force. The data captures fatal encounters Mapping Police Violence but does not include non-fatal police shootings (research suggests that a majority of police shootings are survived).
Therefore, by definition these numbers undercount the total instances of lethal force used by police. When interpreting these statistics, it’s critical to remember that we are looking at deaths only, not all incidents where officers used potentially lethal force.
Additionally, this data represents descriptive statistics only and cannot establish causal relationships without additional controls for local crime rates, police deployment patterns, population demographics, socioeconomic factors, and jurisdictional policies.
Finally, this is a vibe-coded prototype: a rapid, exploratory build to see how far I can get in standing up a public-data dashboard with automated ingestion and basic visuals. You definitely should not rely on these numbers in any kind of professional capacity without further investigation and validation.
Critical disclaimer: I have not independently verified the MPV data, nor have I formally audited or validated my cleaning and harmonization routines. Treat everything here as exploratory and illustrative. The outputs are not suitable for professional, policy, legal, journalistic, or operational use, and should not be relied upon as an authoritative accounting of levels, rates, rankings, or trends.
Automatic Data Updates
This post automatically downloads the latest data from Mapping Police Violence whenever the website is rebuilt. The visualizations below will update as new data becomes available.
Data Summary
Data current as of January 04, 2026
- All Deaths: 14,806 incidents from January 01, 2013 to December 31, 2025
- Fatal Shootings: 14,110 incidents (95.3%)
- Years covered: 2013 - 2025
Cumulative Trends
These charts show the cumulative count of police killings throughout each year, allowing year-over-year comparison.
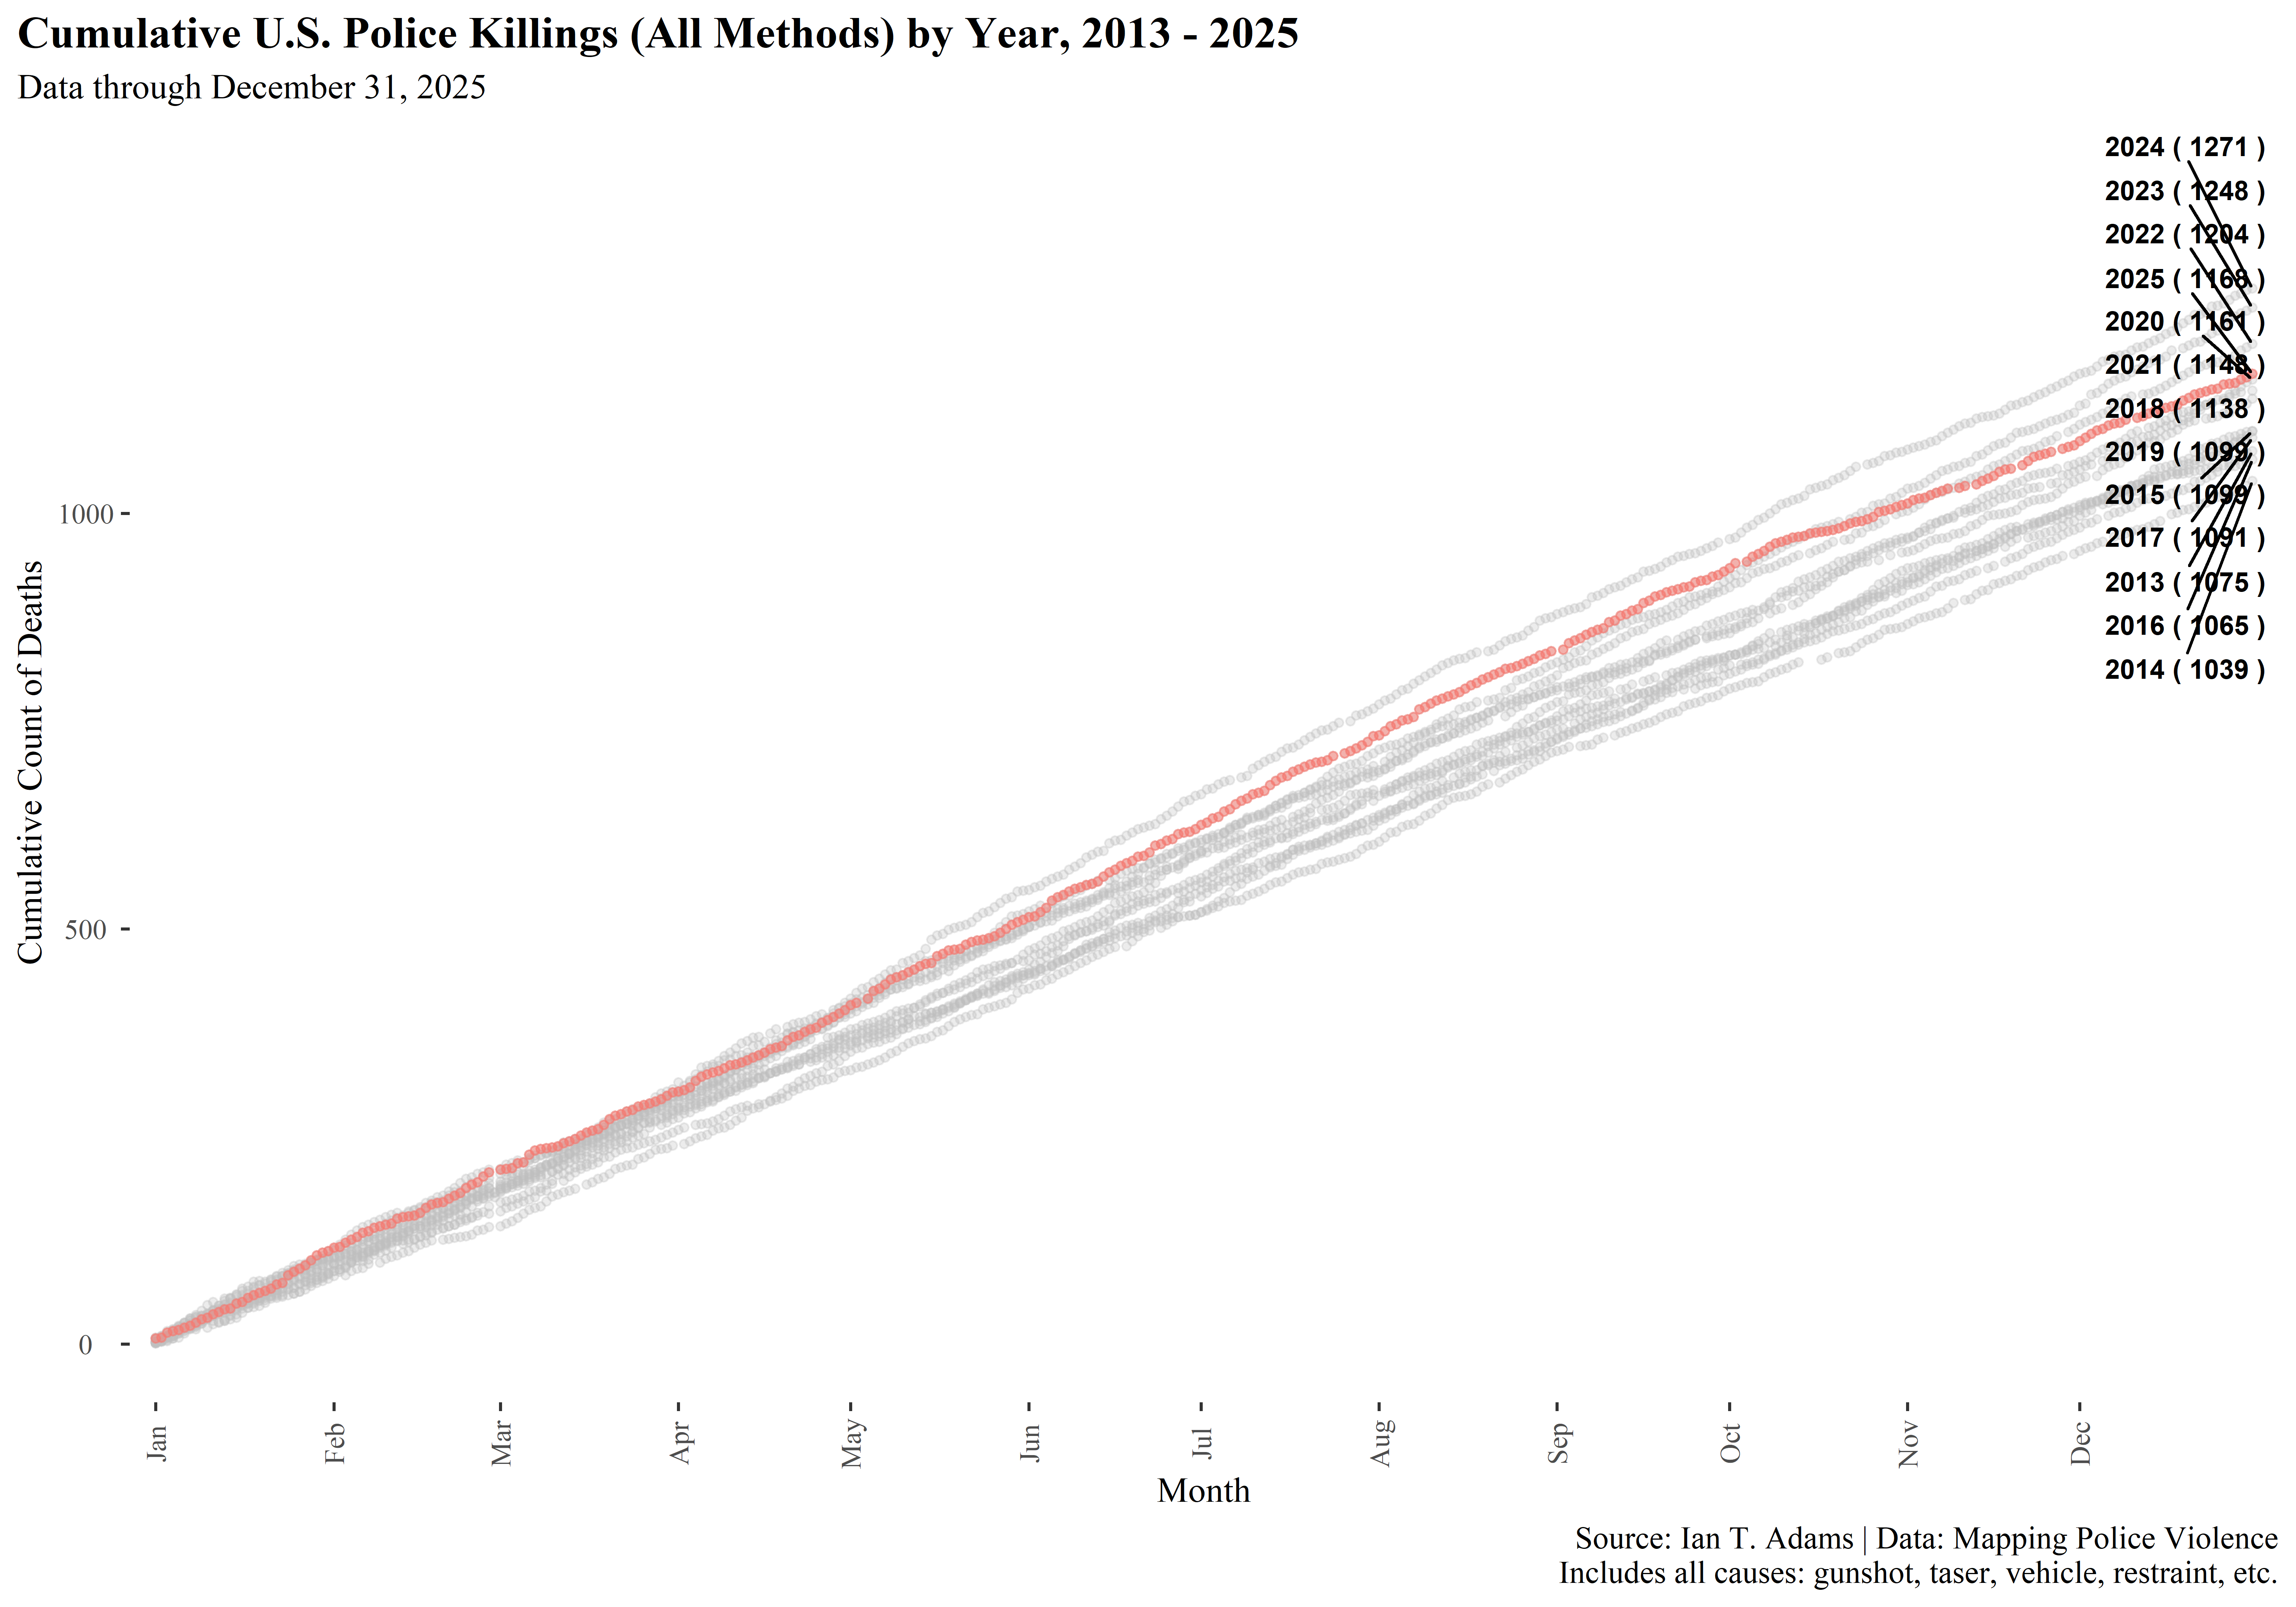
Figure 1: Cumulative count of all police killings by method (gunshot, taser, vehicle, restraint, etc.)
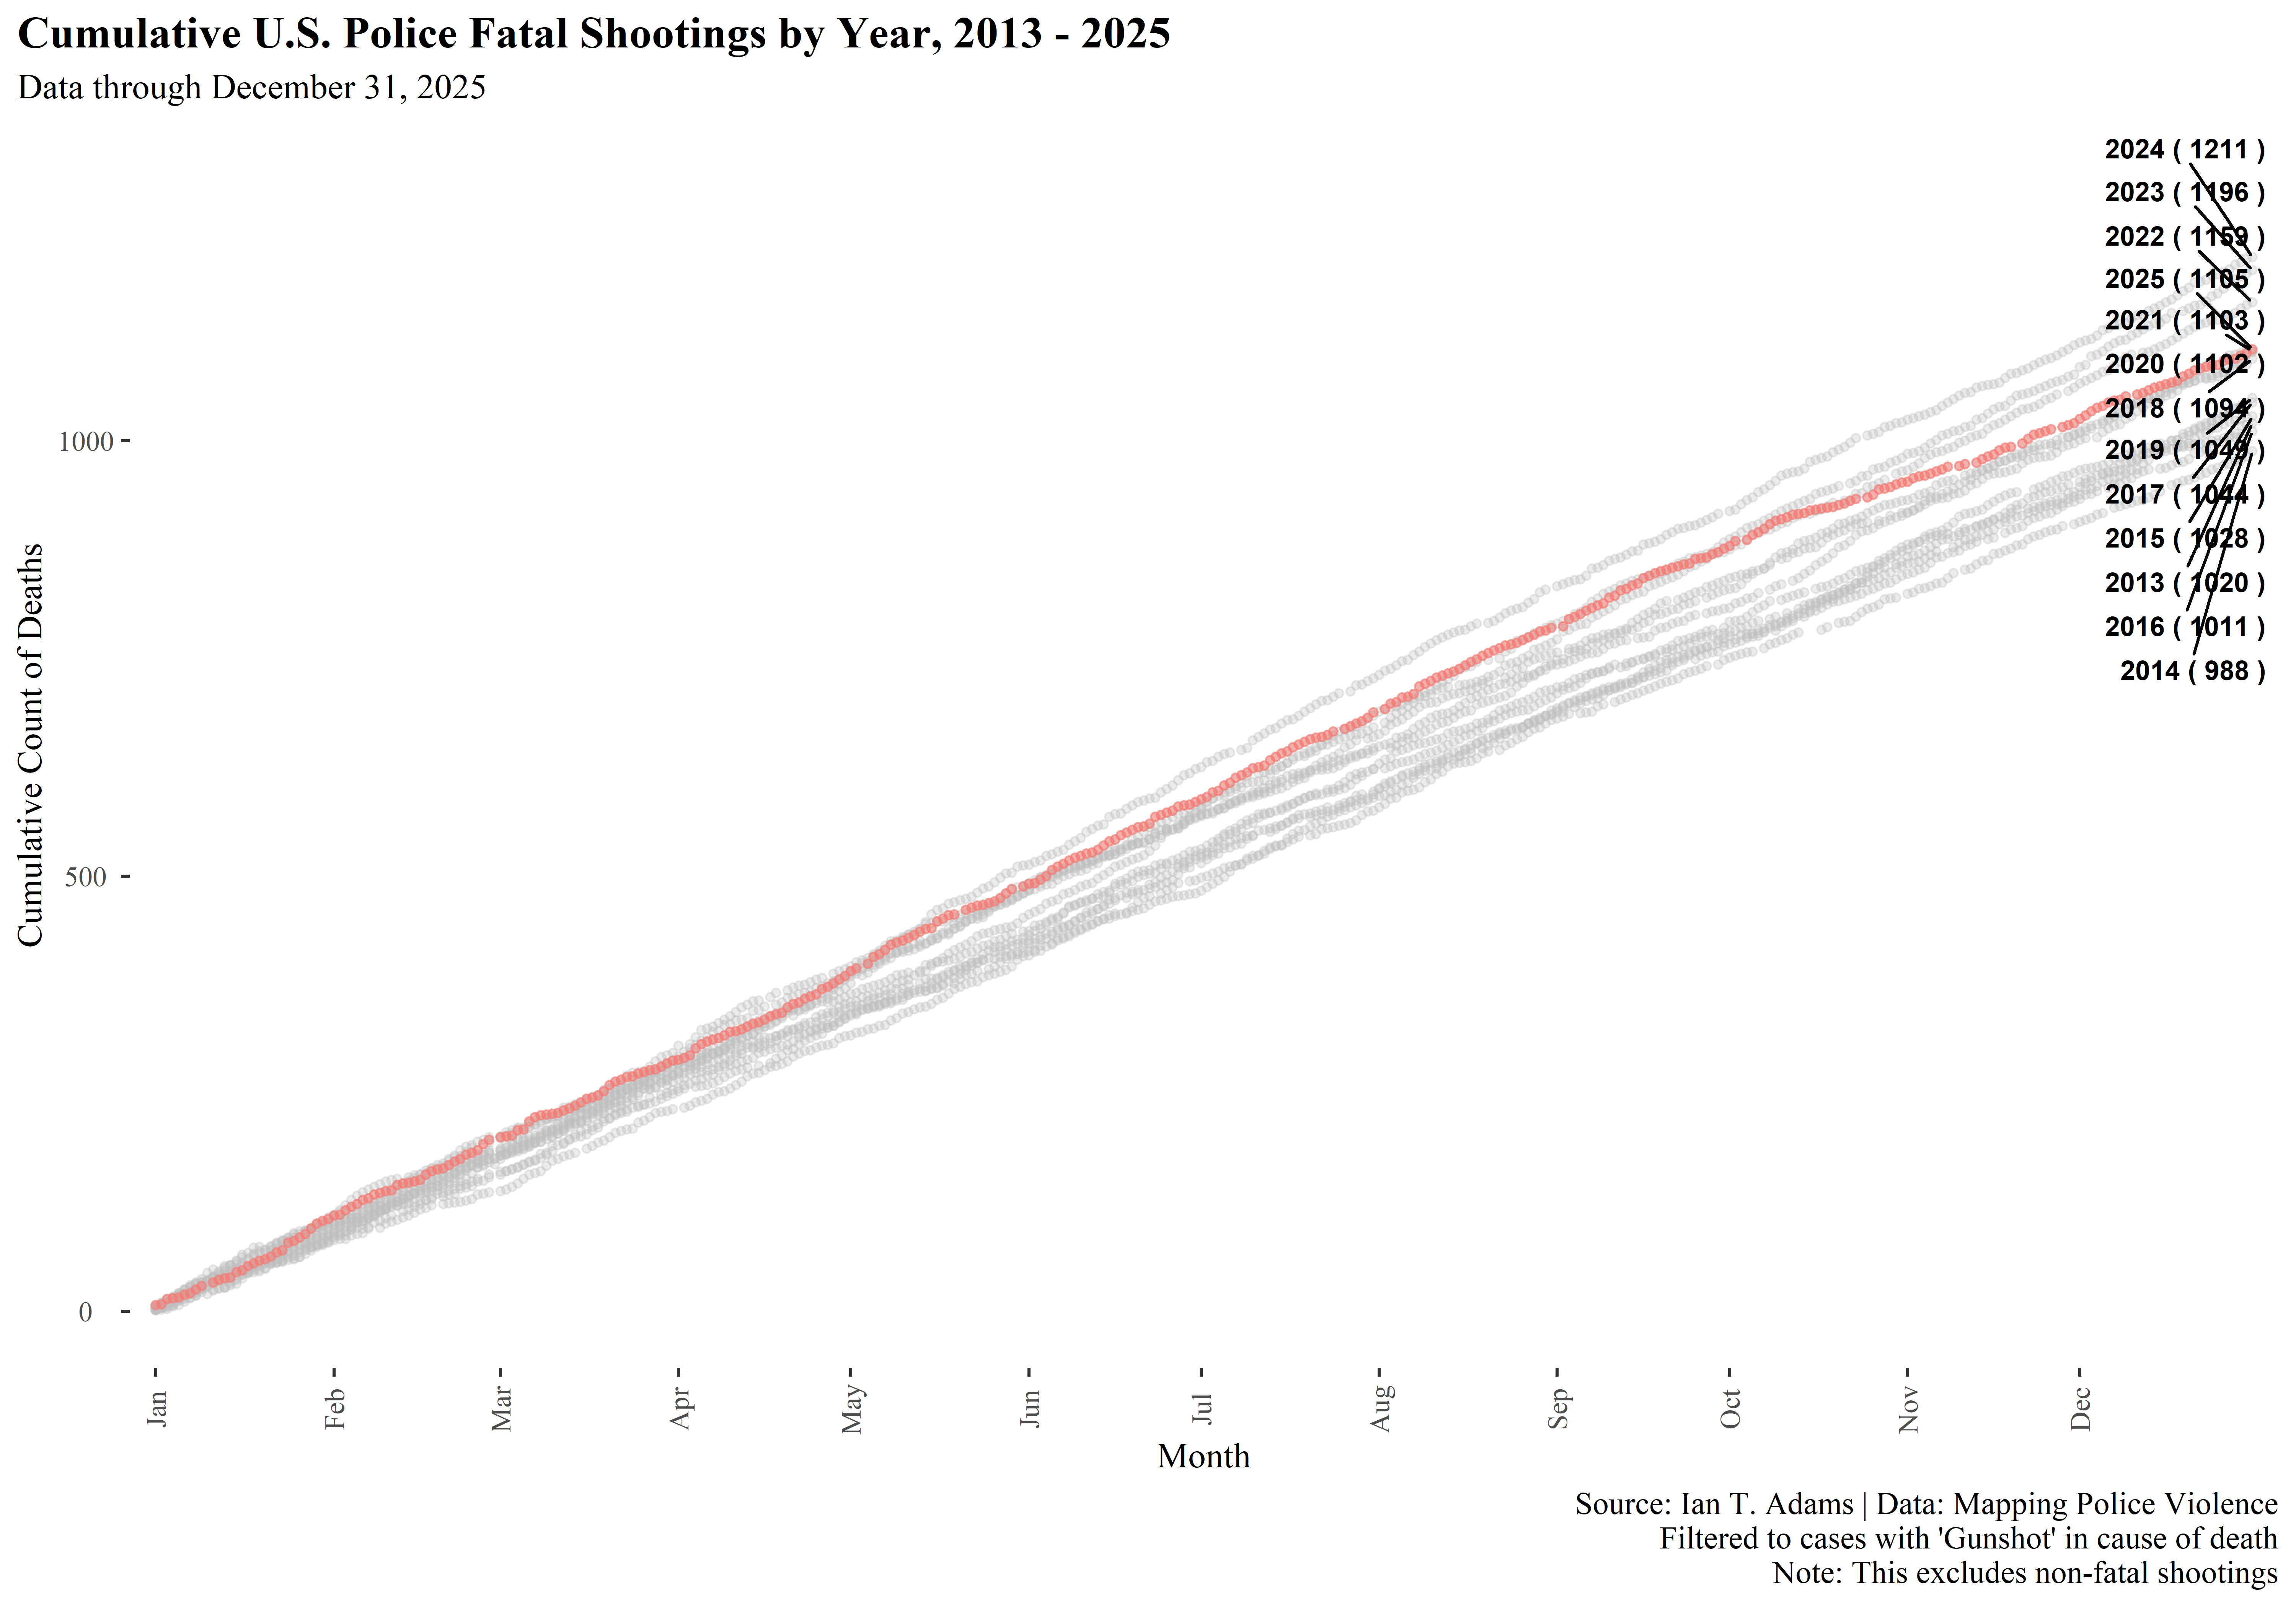
Figure 2: Cumulative count of fatal police shootings only
Demographic Patterns
Race and Ethnicity
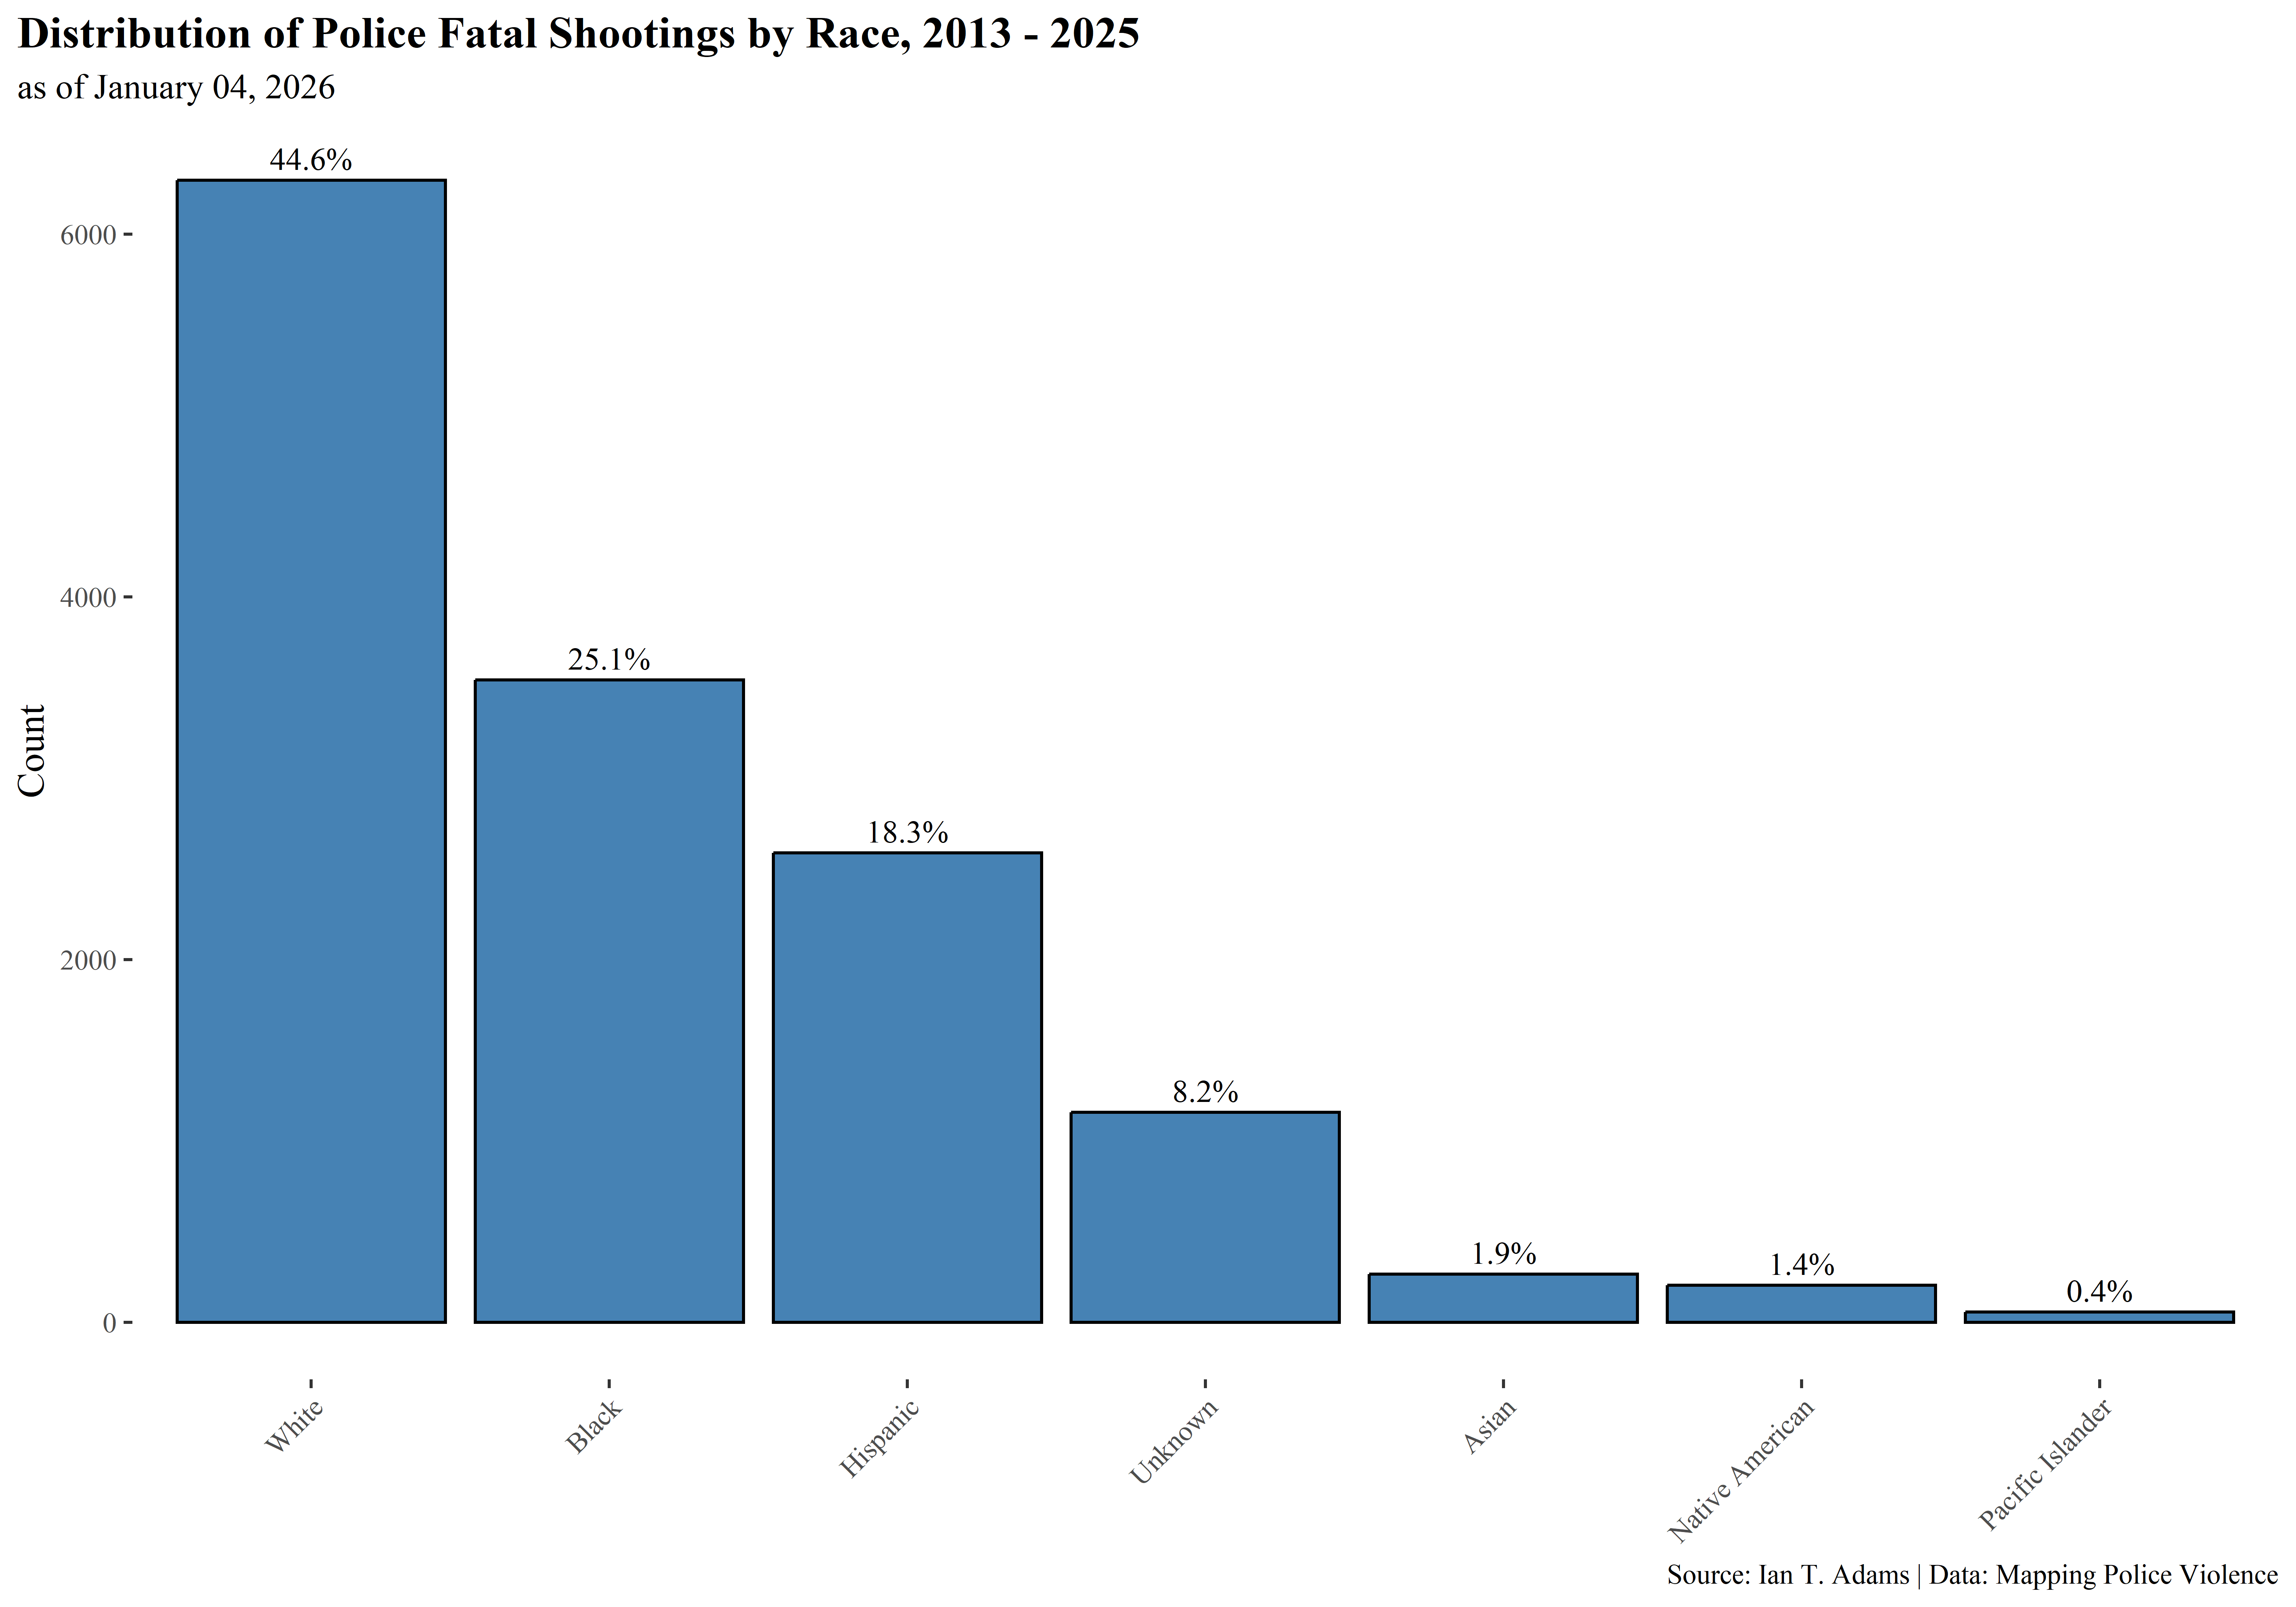
Figure 3: Distribution of fatal police shootings by race/ethnicity
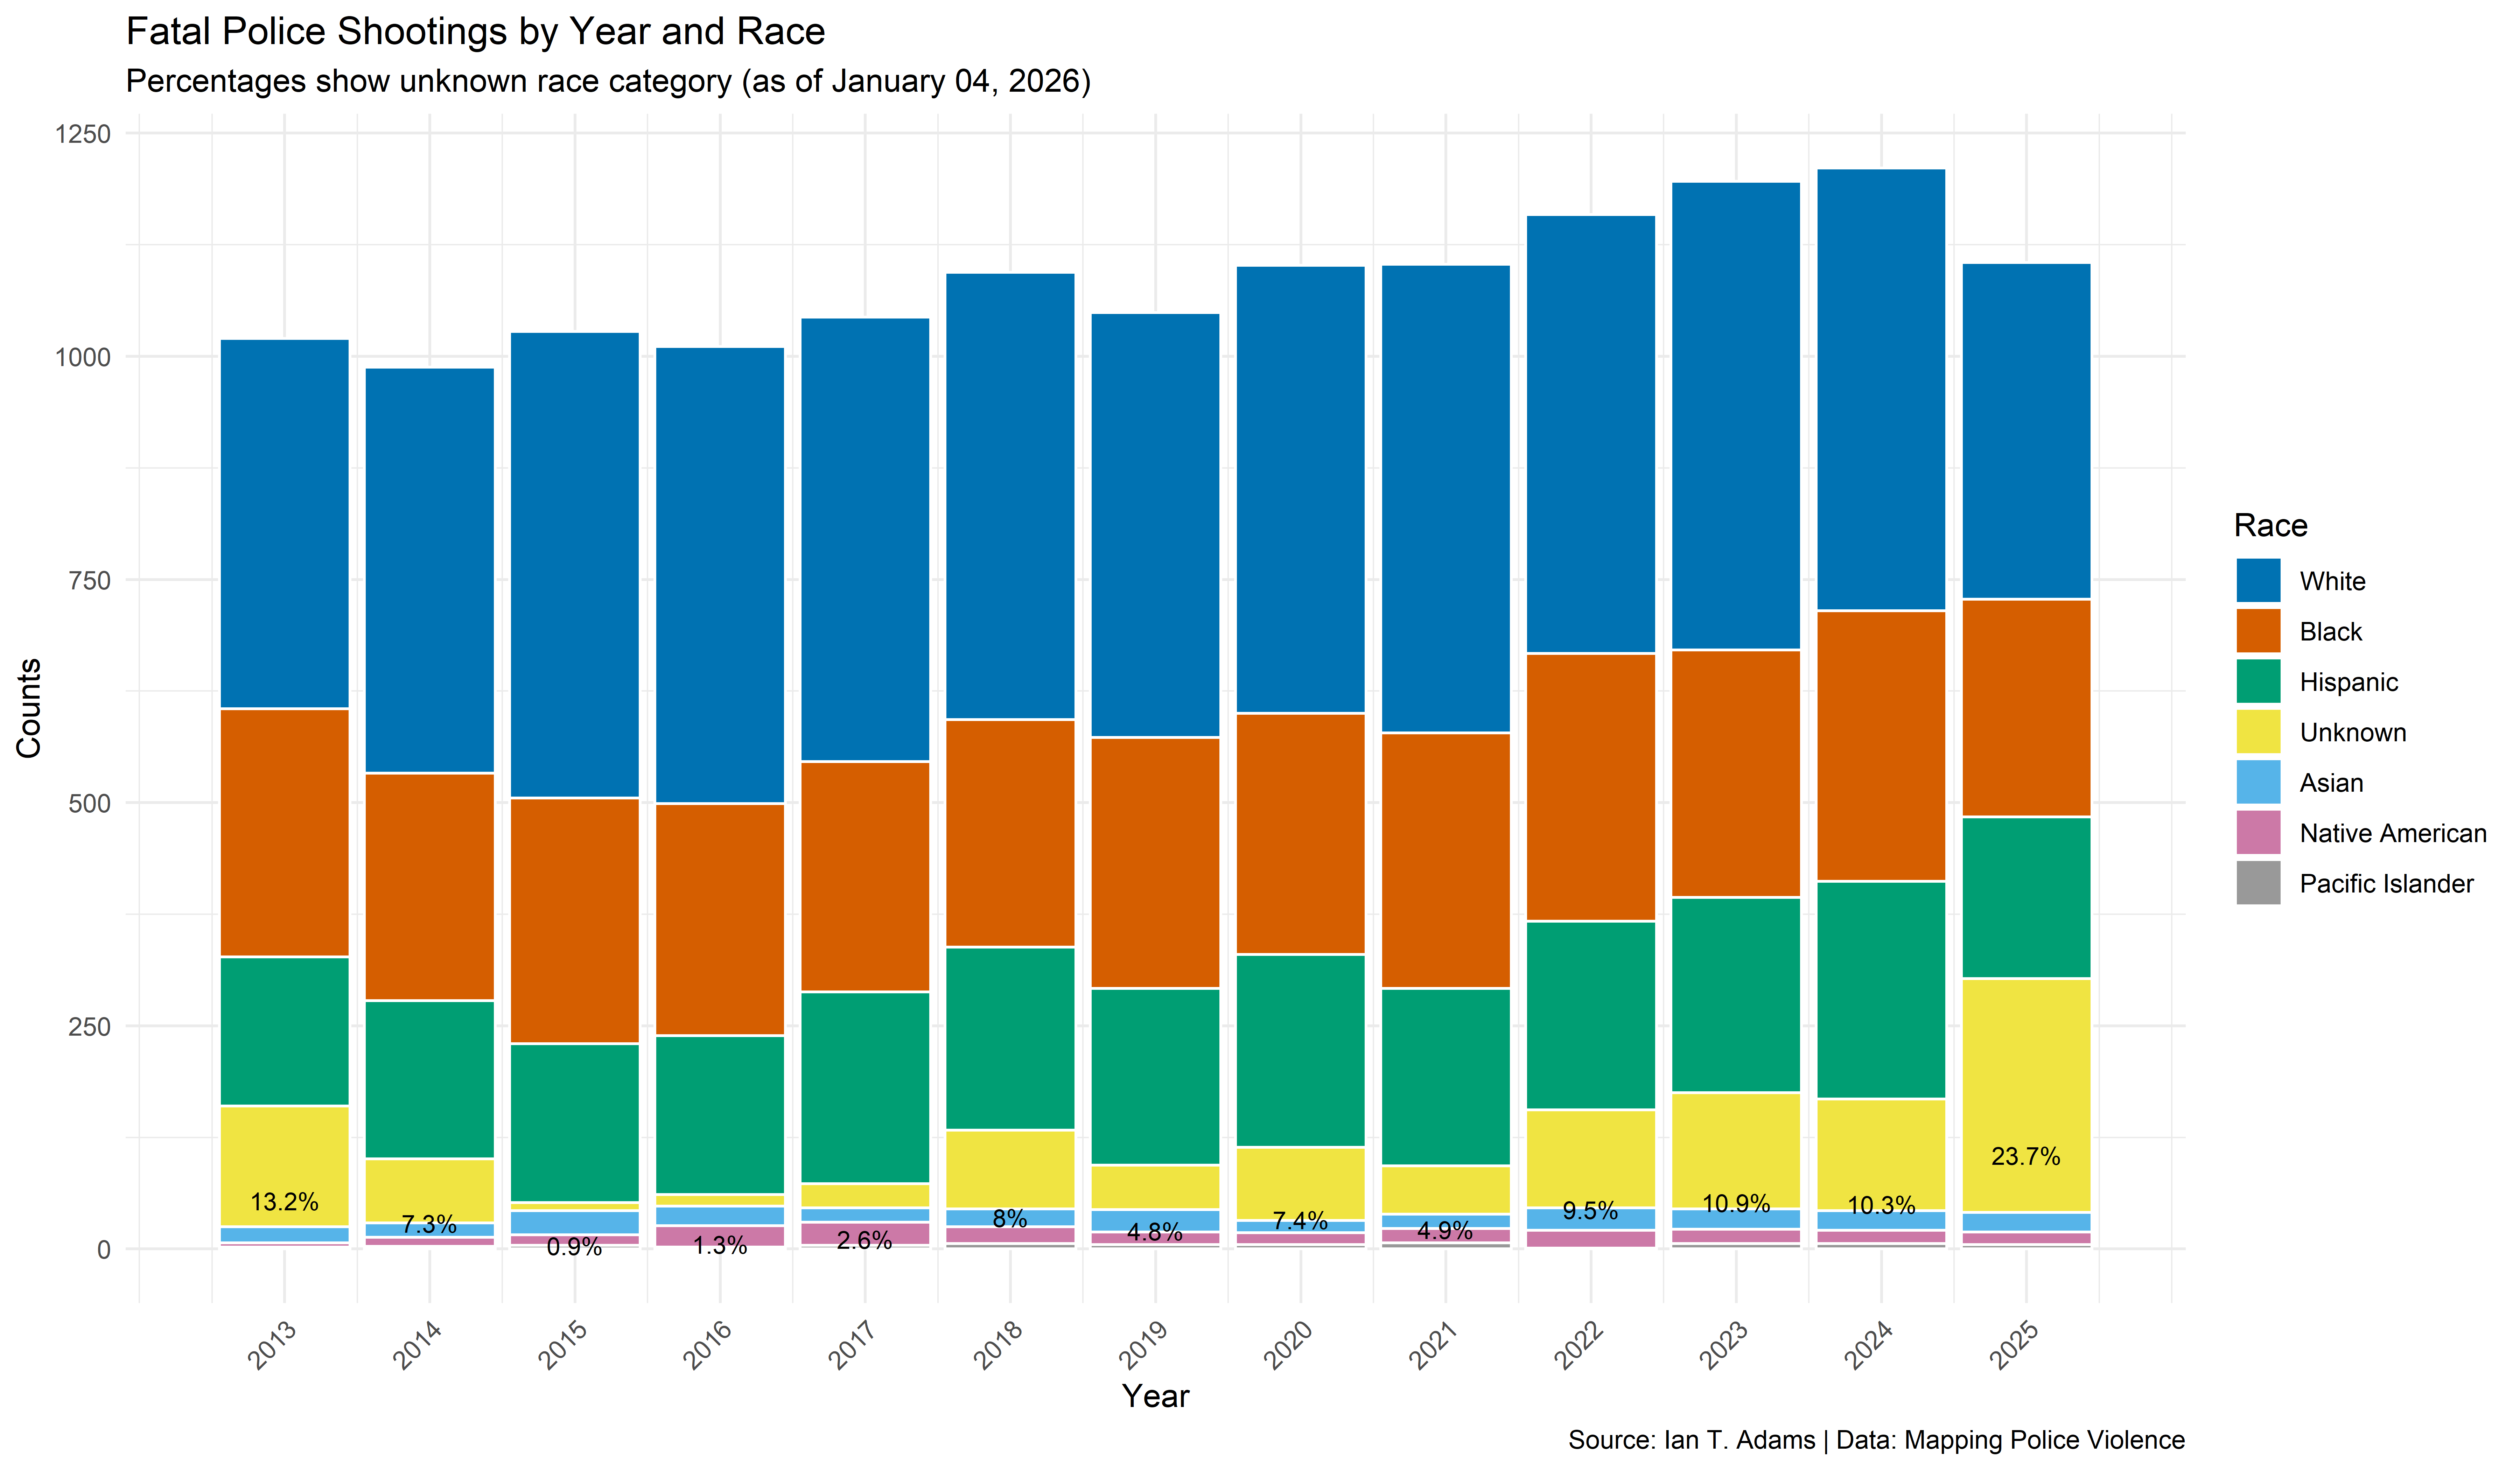
Figure 4: Fatal police shootings by year and race, with percentage of unknown race highlighted
Age Distribution
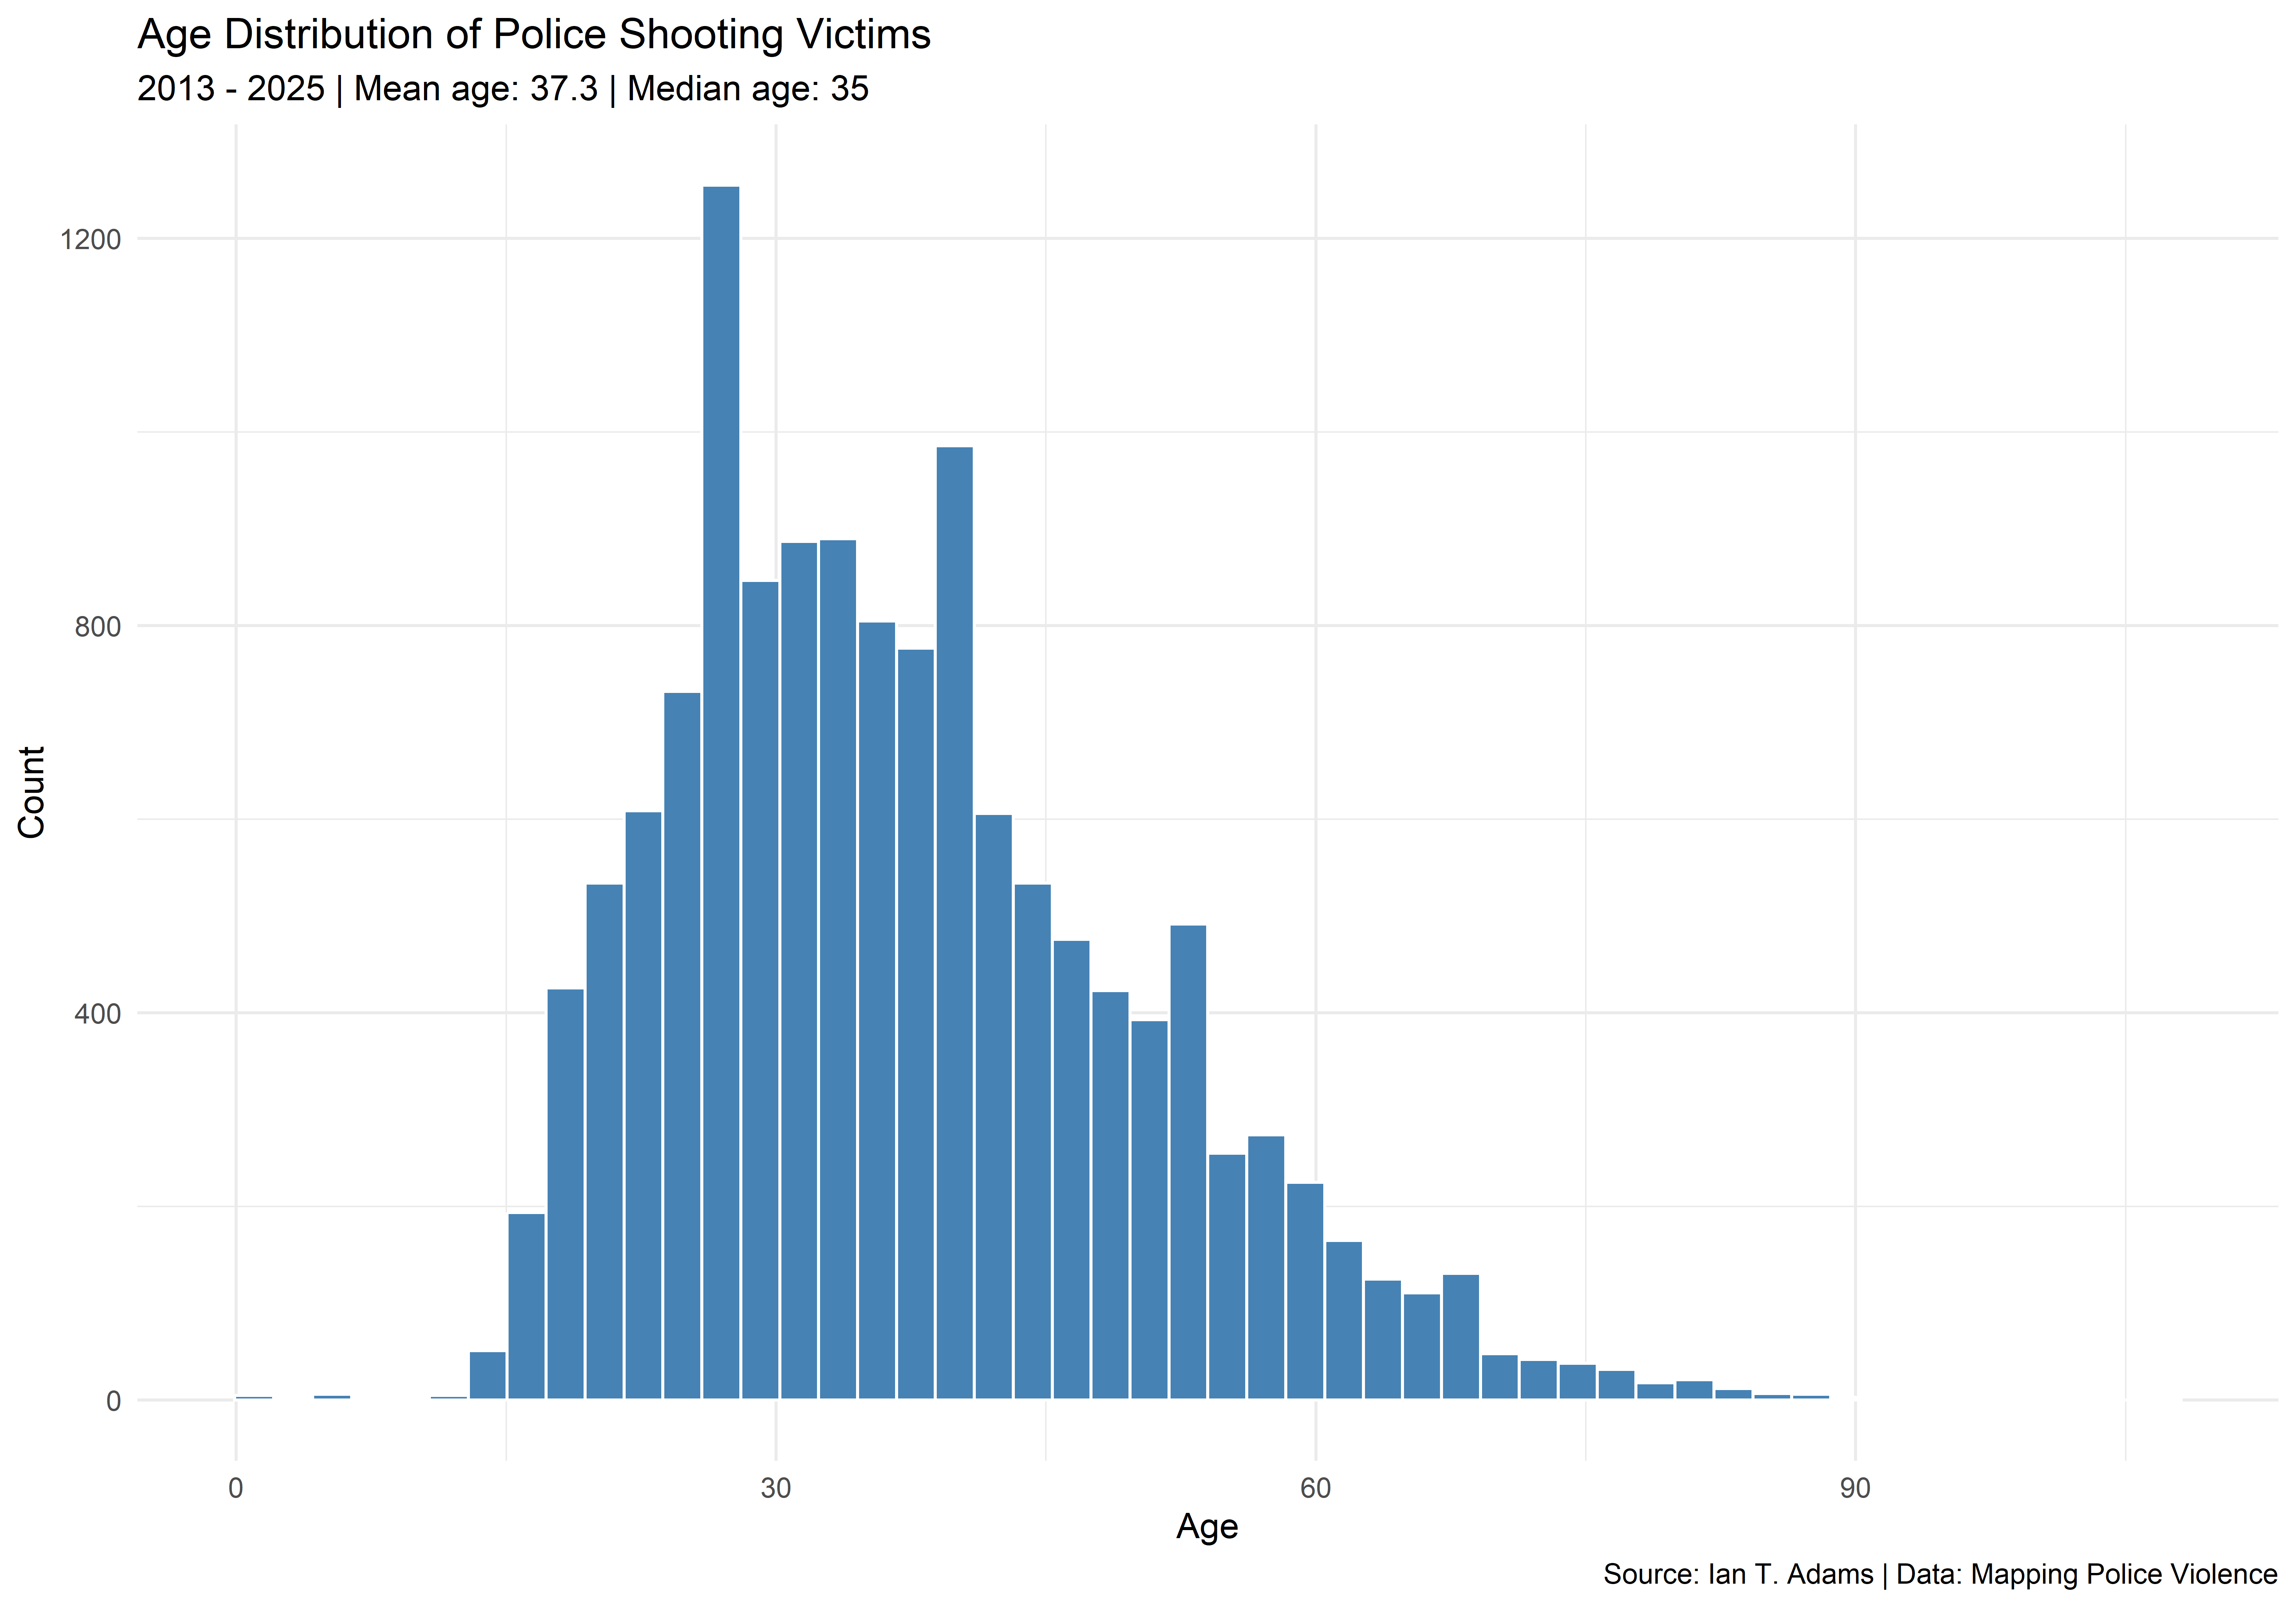
Figure 5: Age distribution of police shooting victims
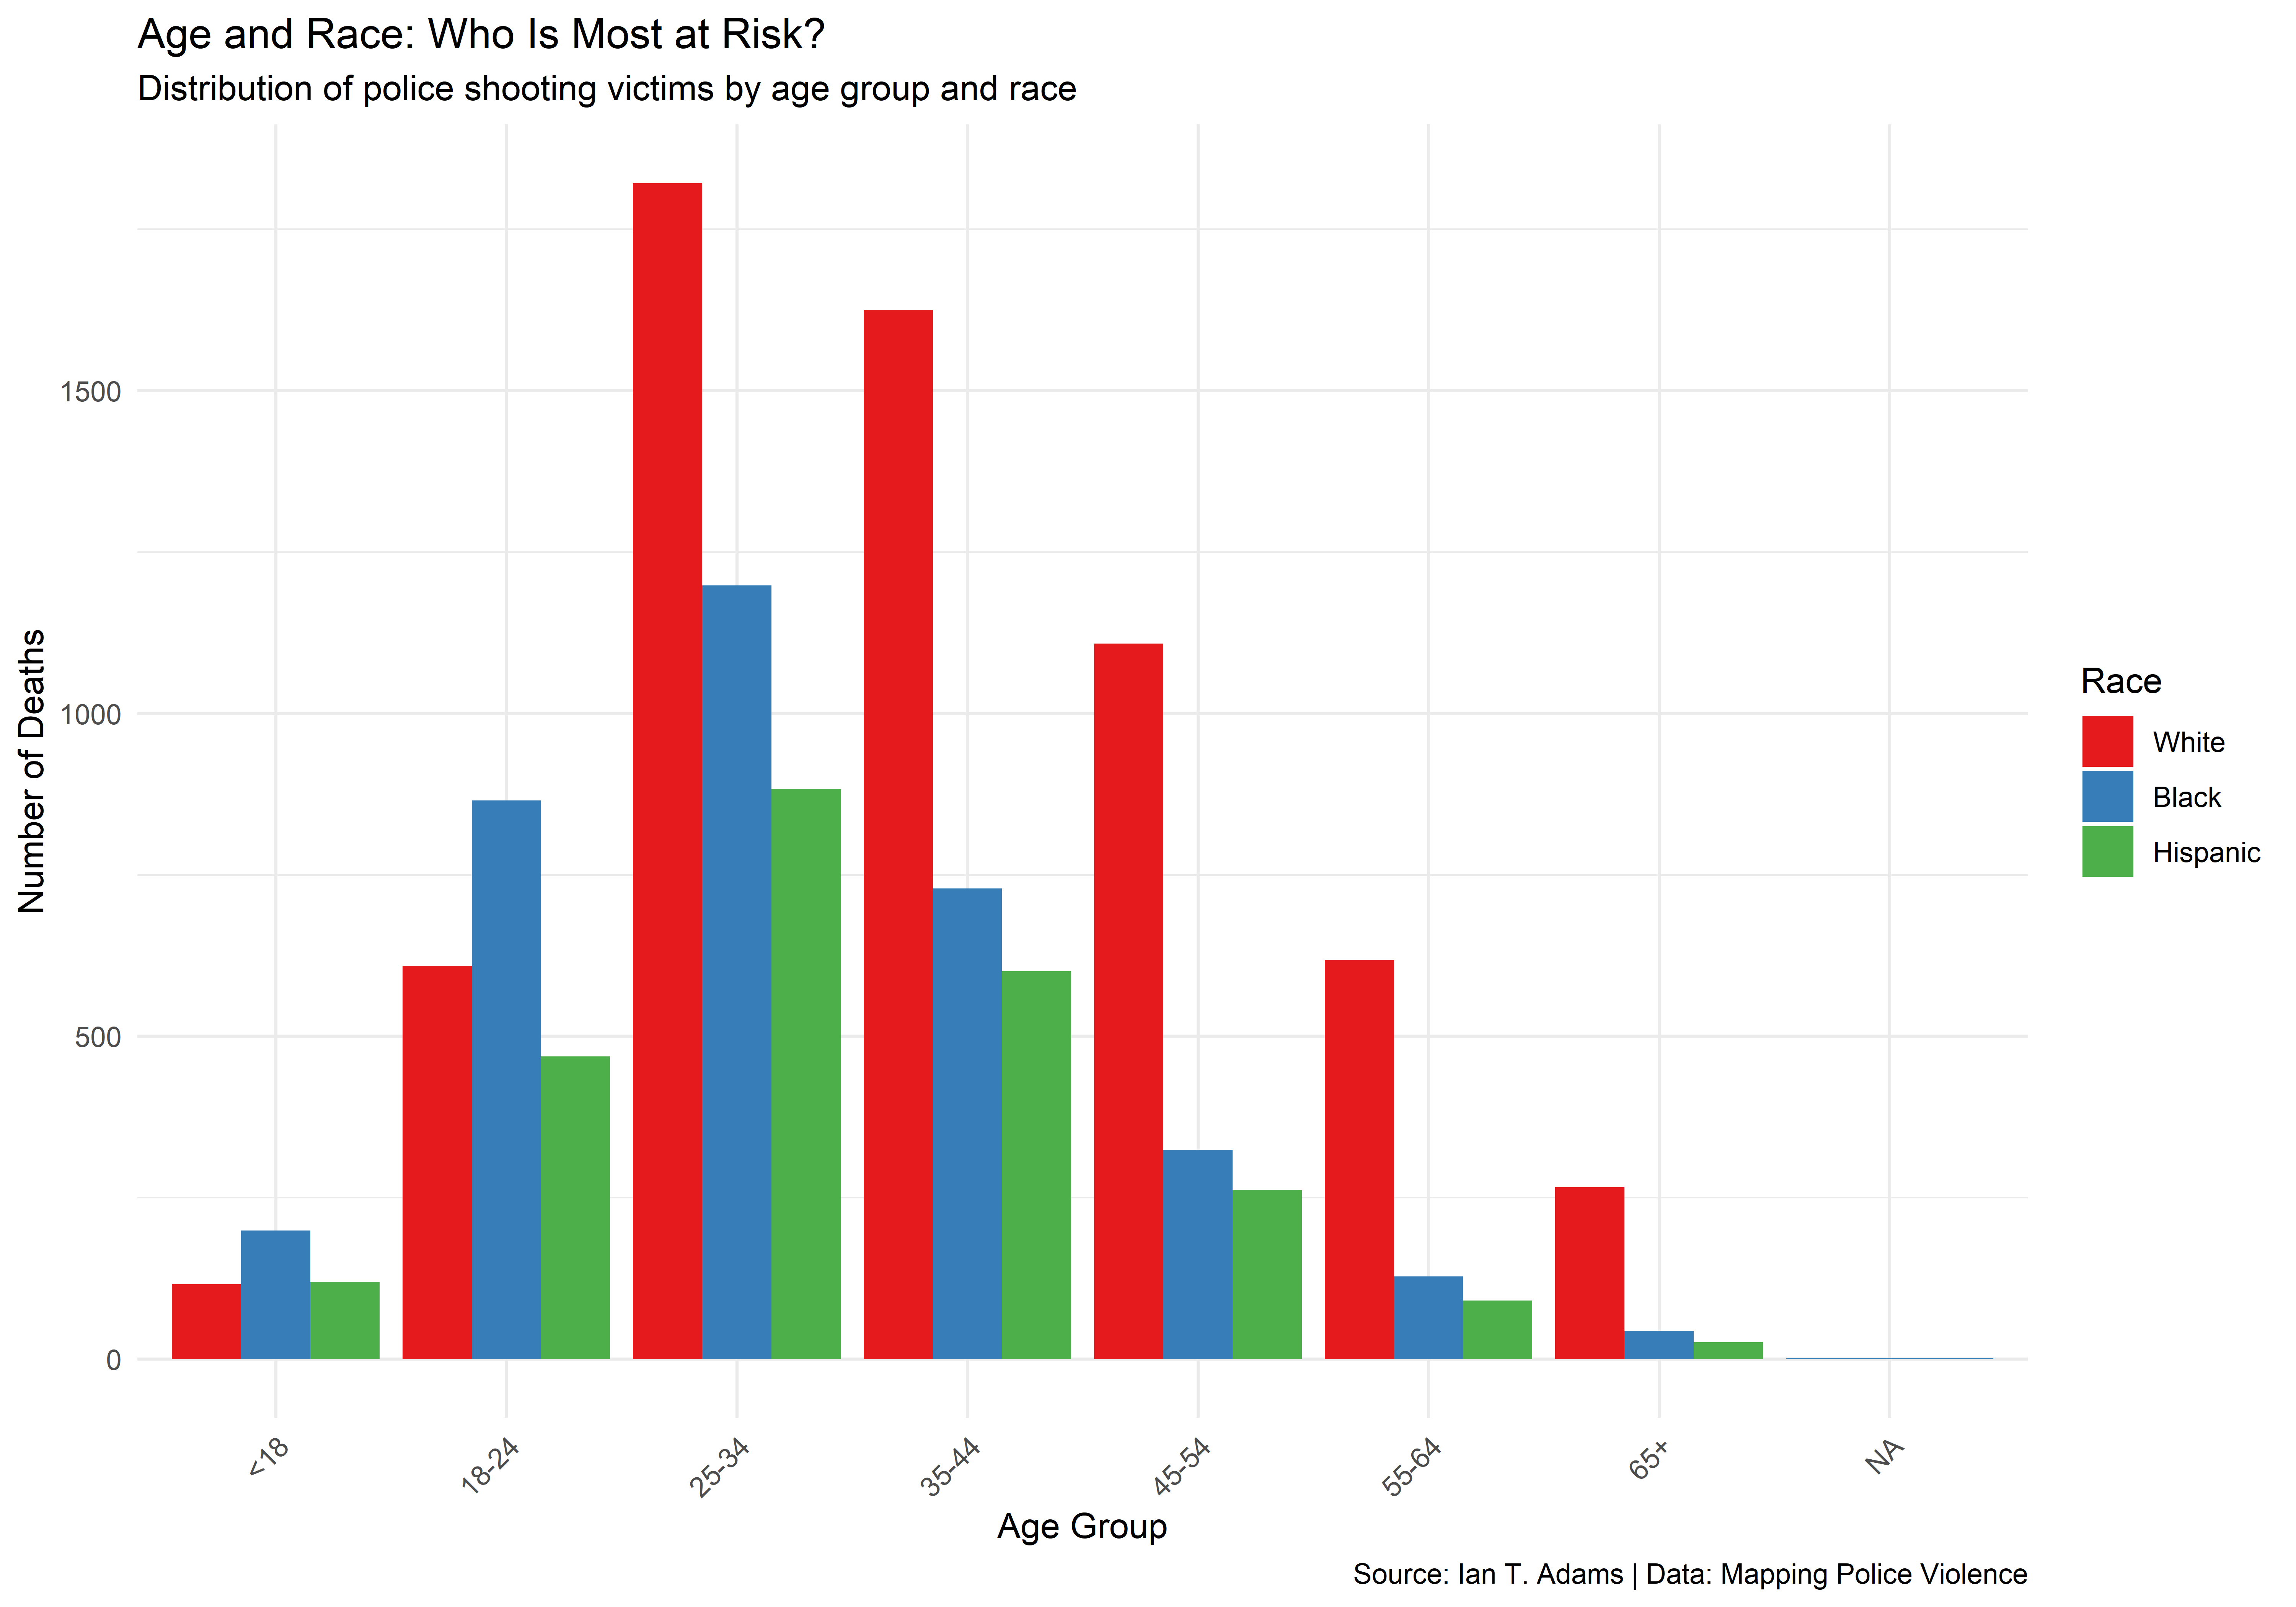
Figure 6: Age distribution by race for the three largest racial groups
Behavioral Context
Armed Status
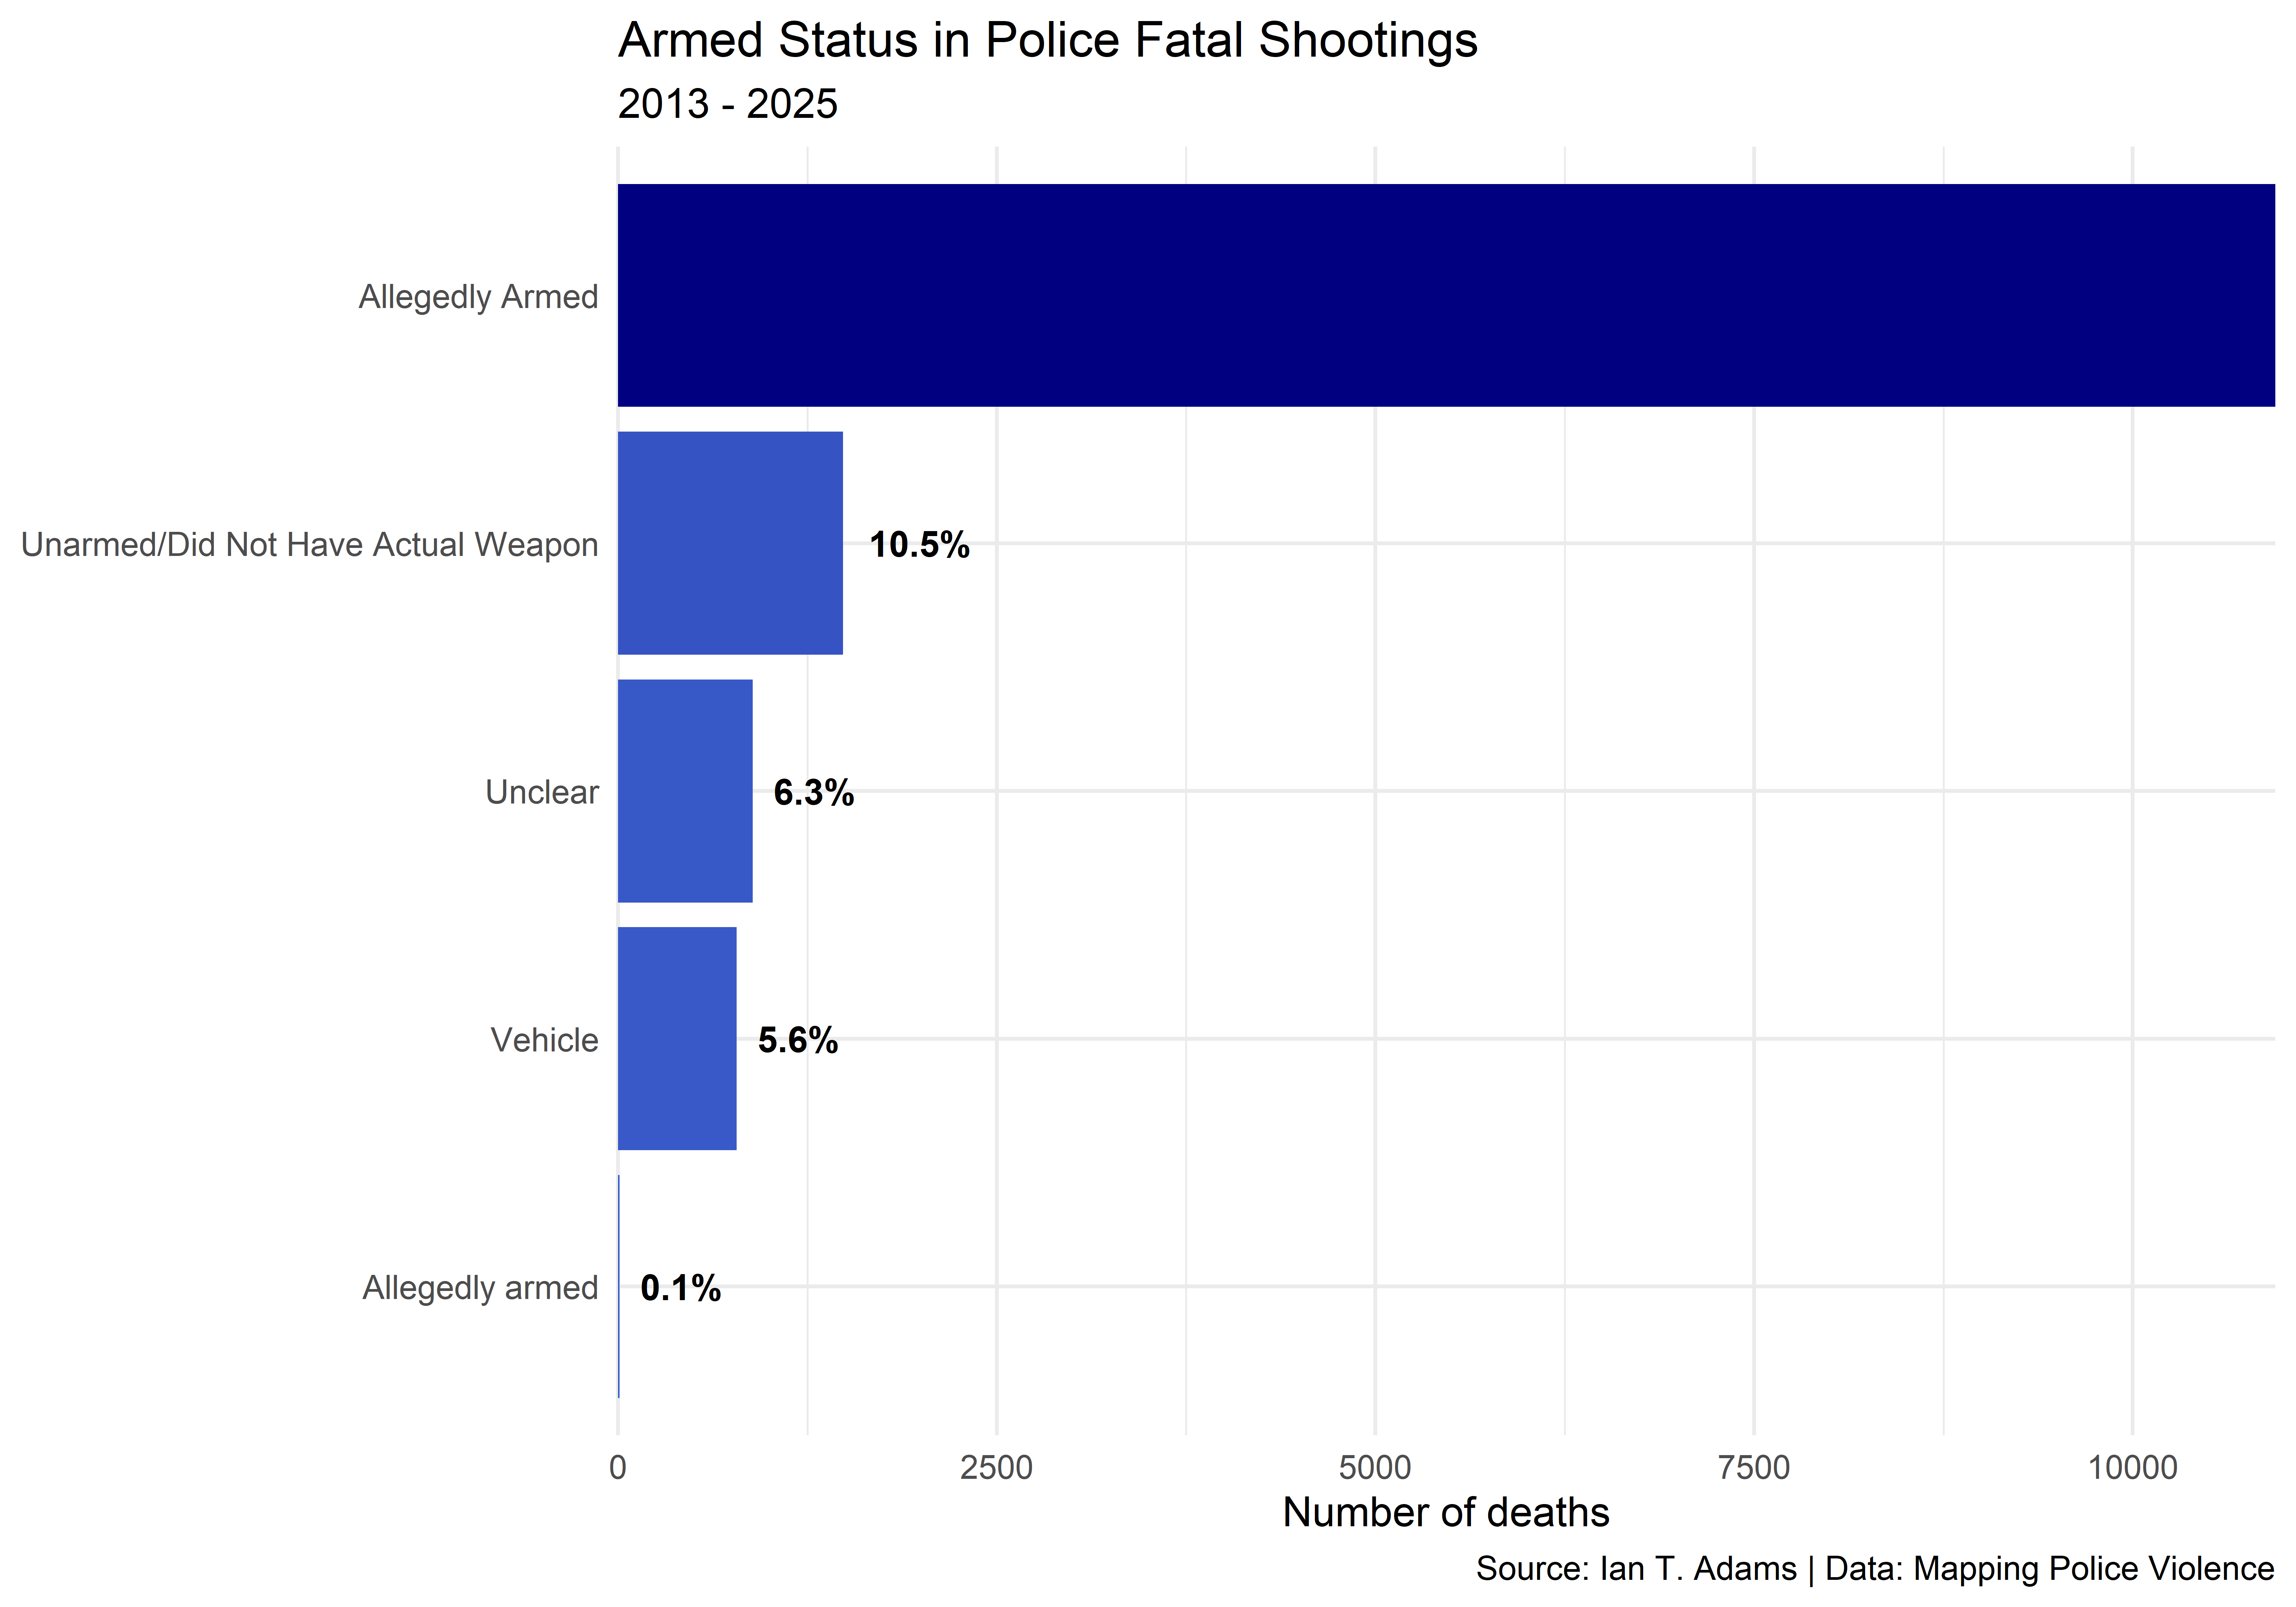
Figure 7: Armed/unarmed status of police shooting victims
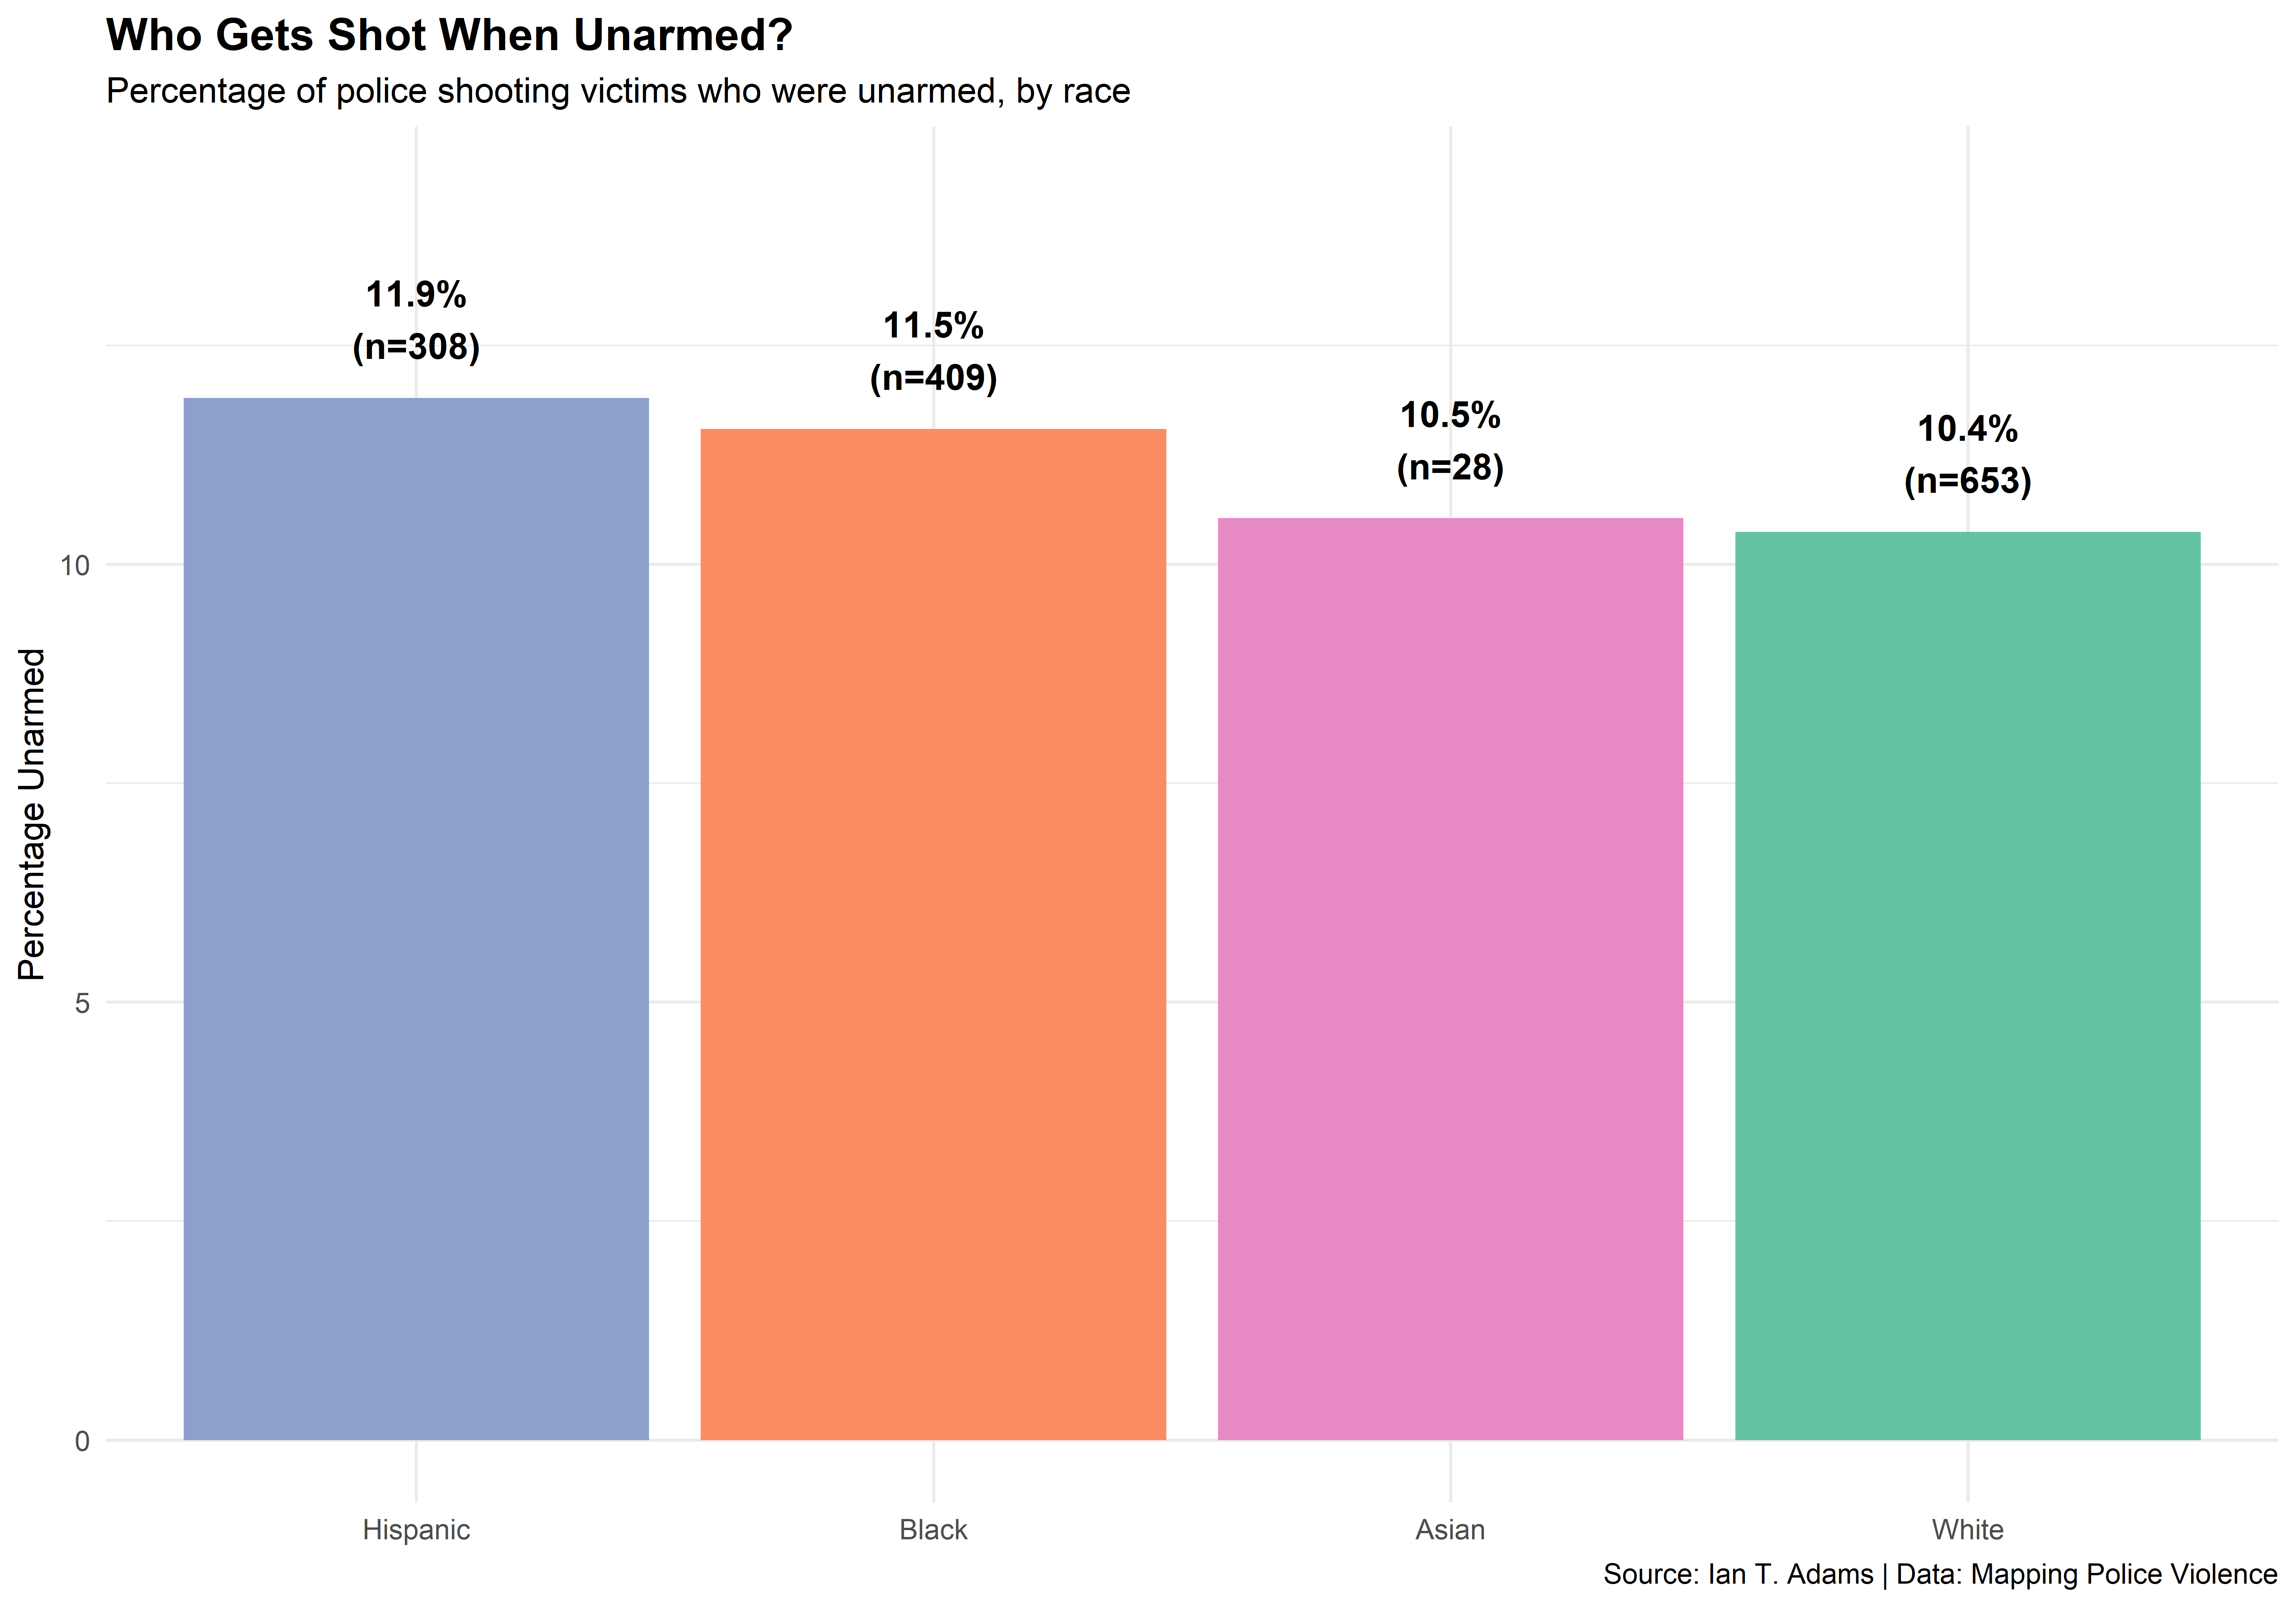
Figure 8: Percentage of victims who were unarmed, by race
Mental Health Context
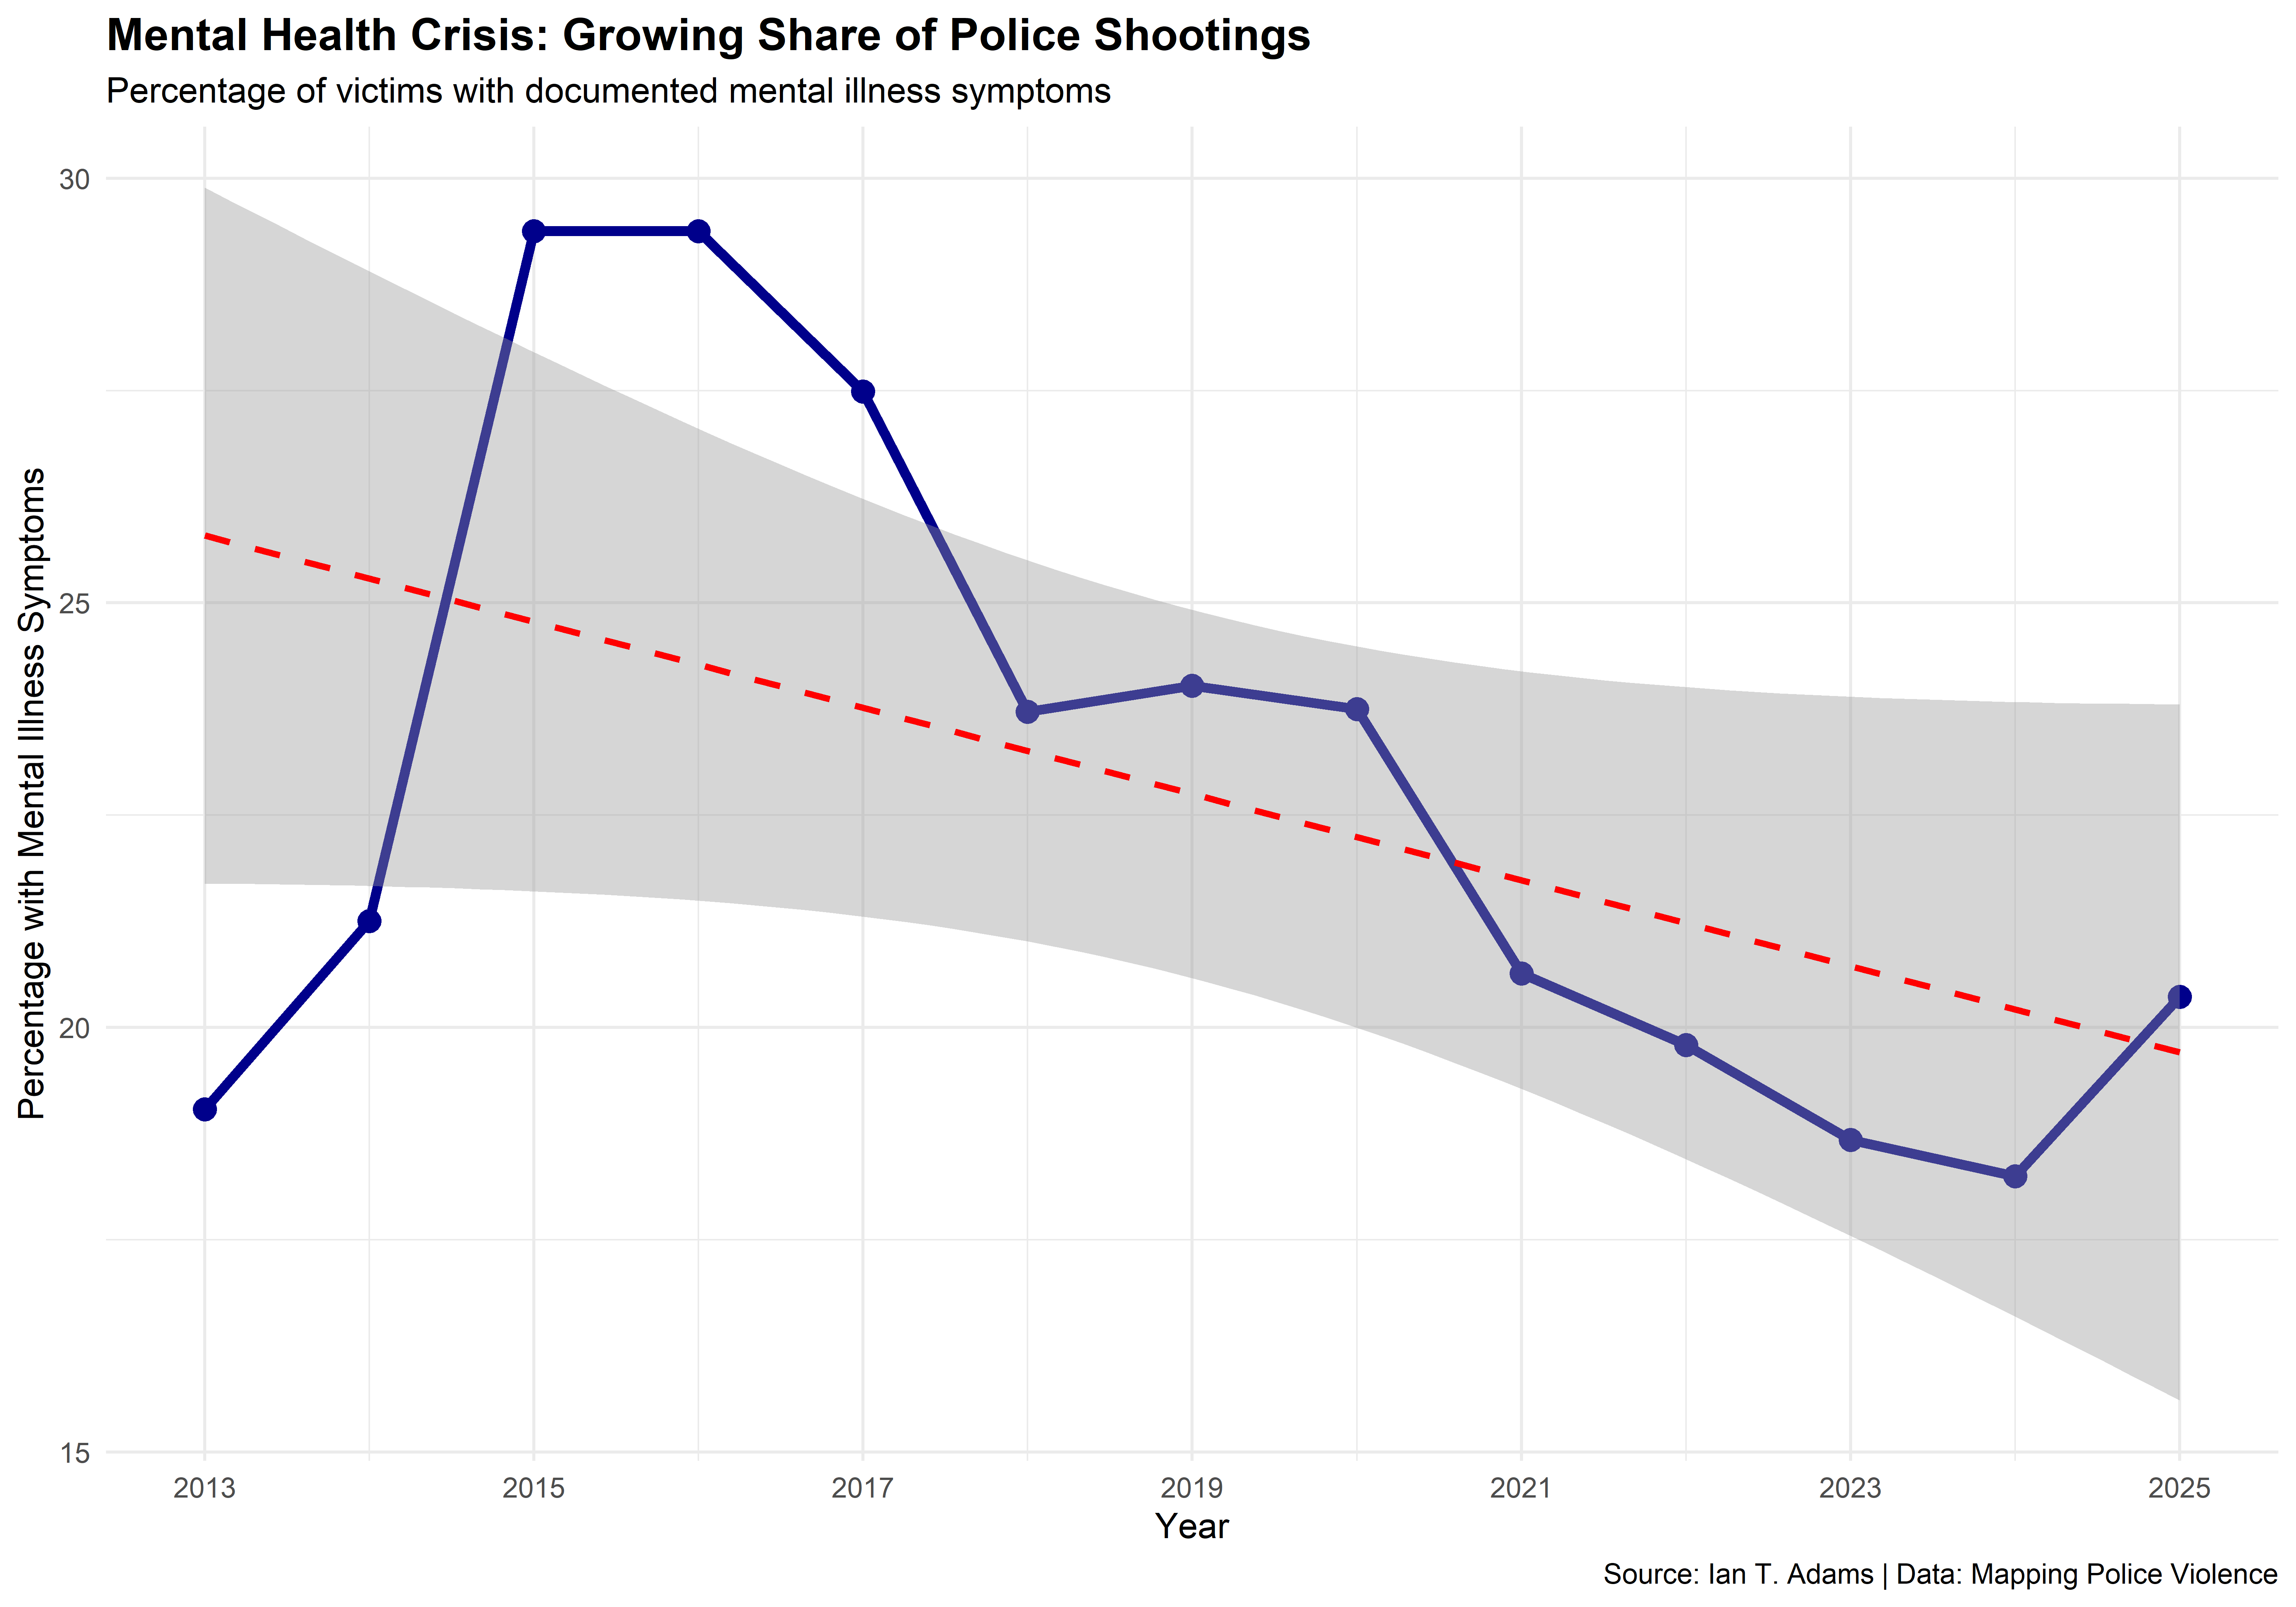
Figure 9: Percentage of victims with documented mental illness symptoms over time
Temporal Patterns
When Do Shootings Occur?
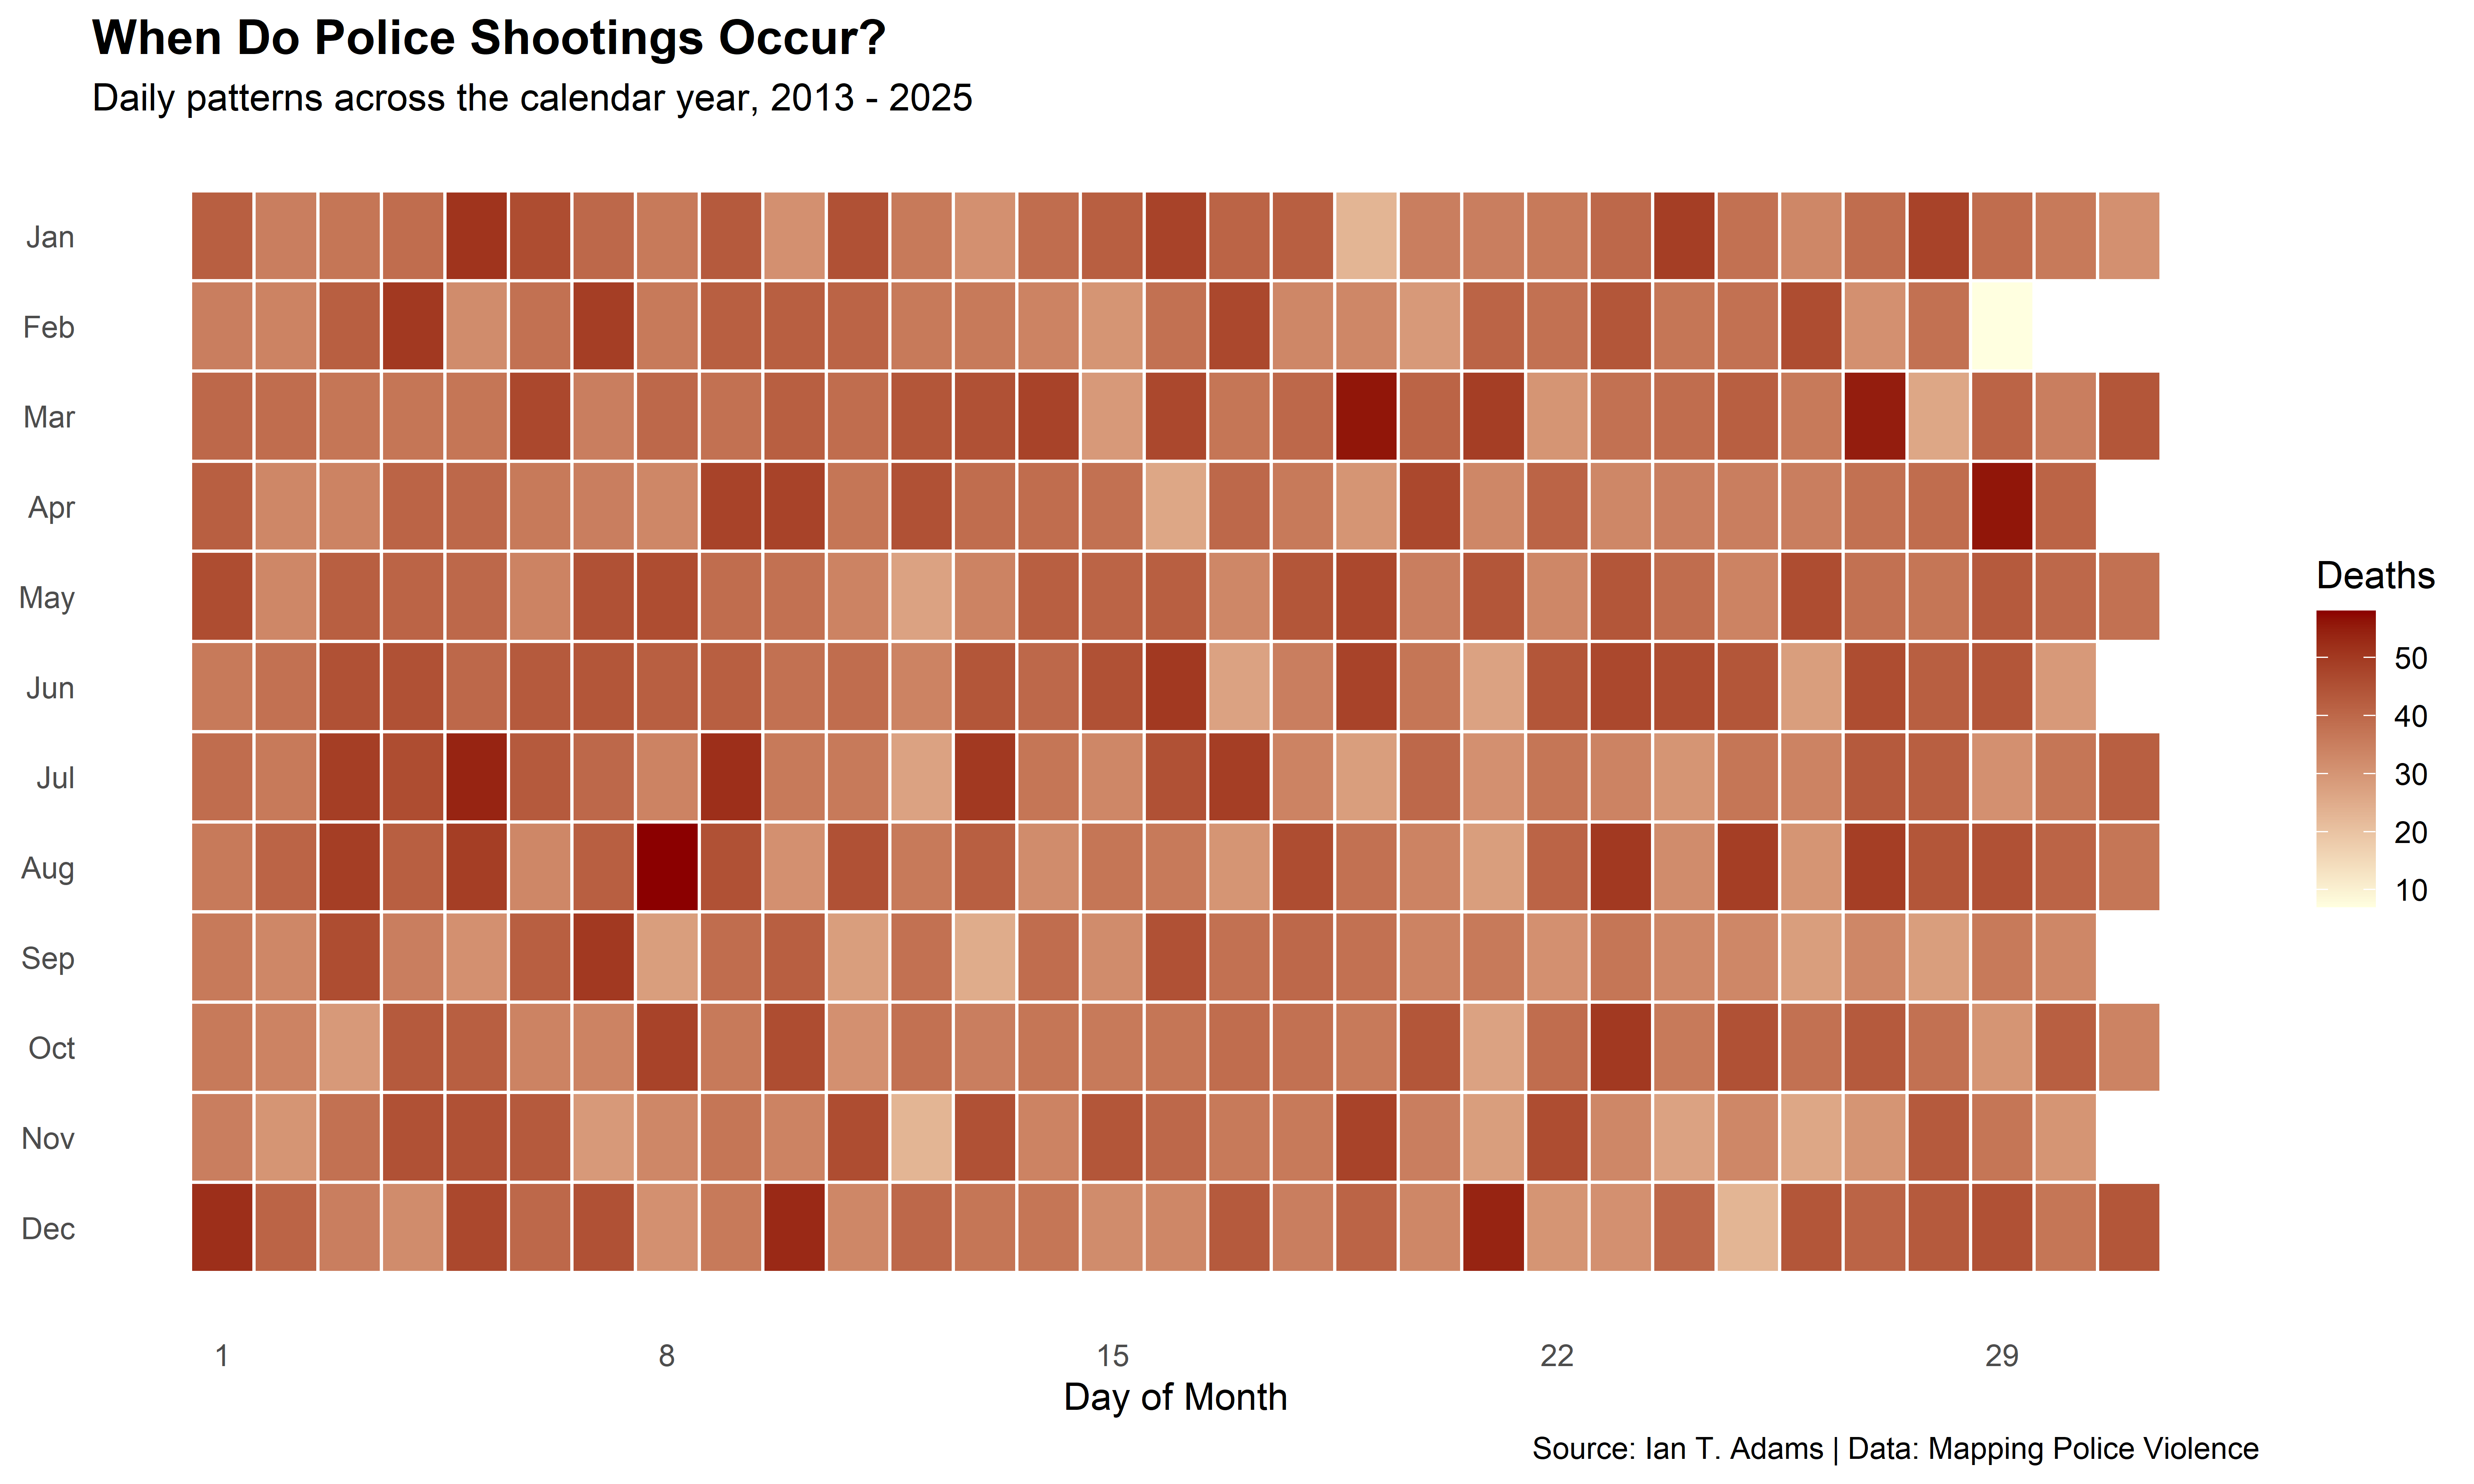
Figure 10: Heatmap showing daily patterns of police shootings across the calendar year
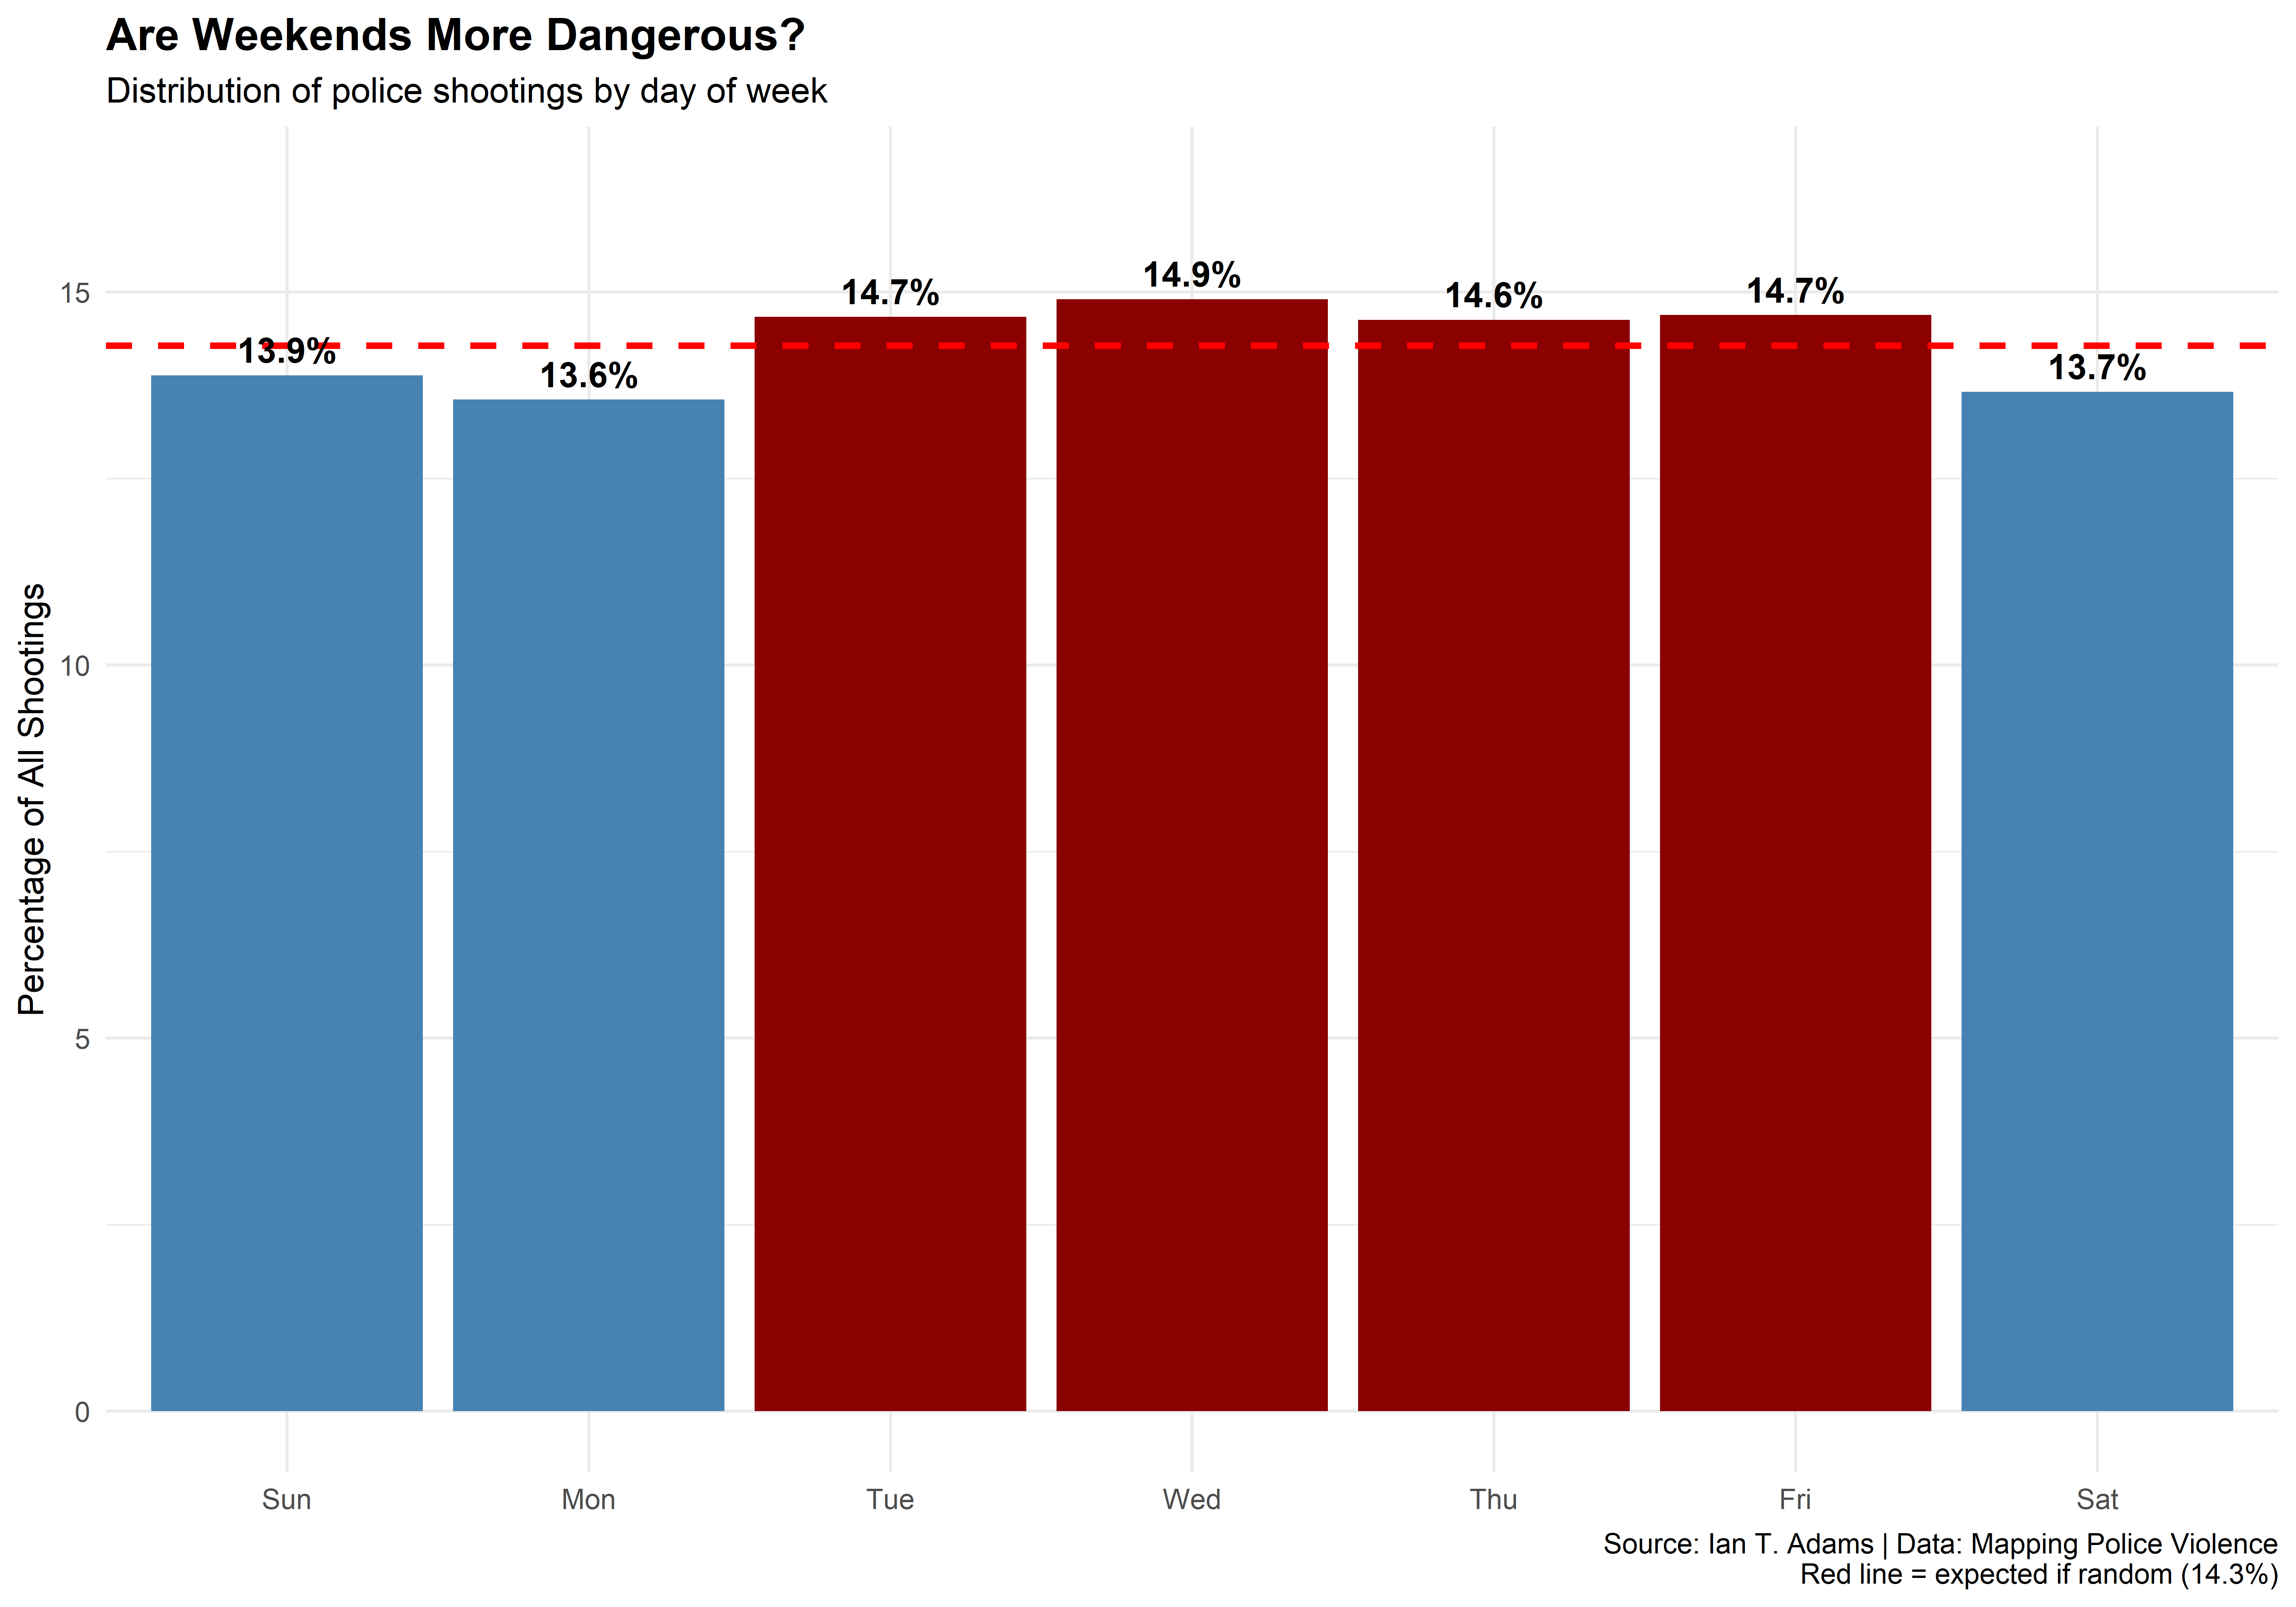
Figure 11: Distribution of police shootings by day of week
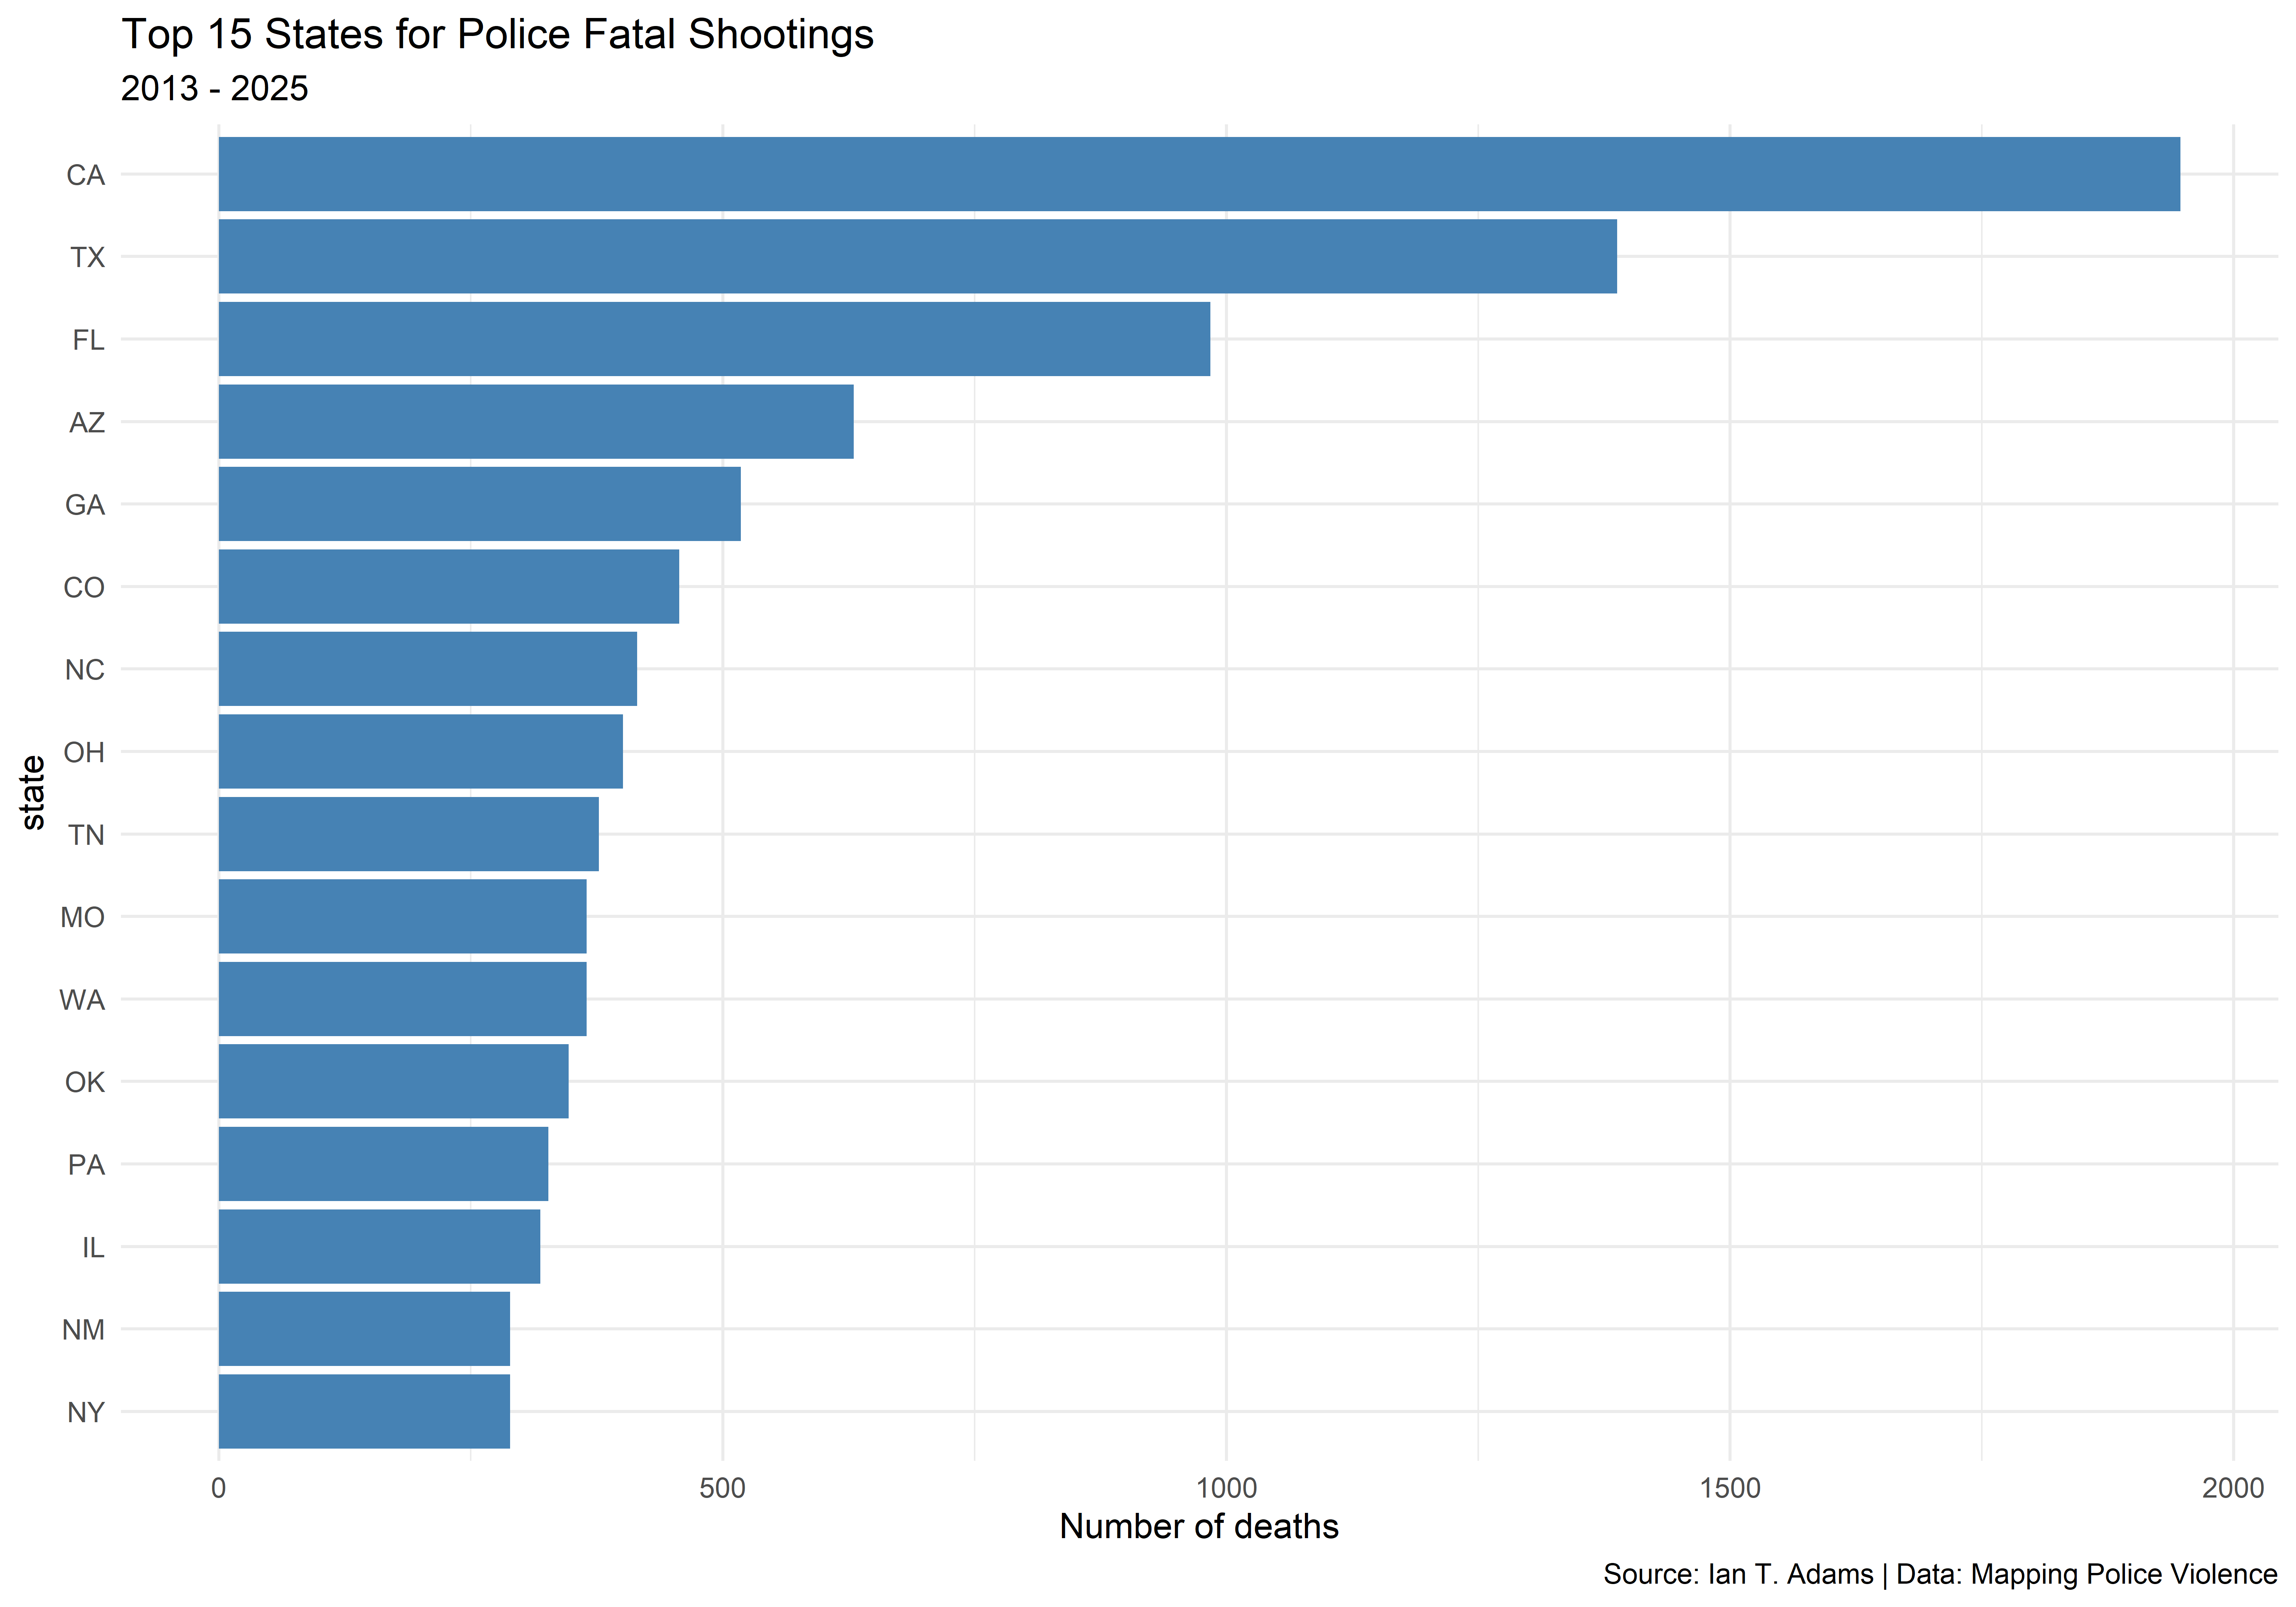
Figure 12: Top 15 states by number of police fatal shootings
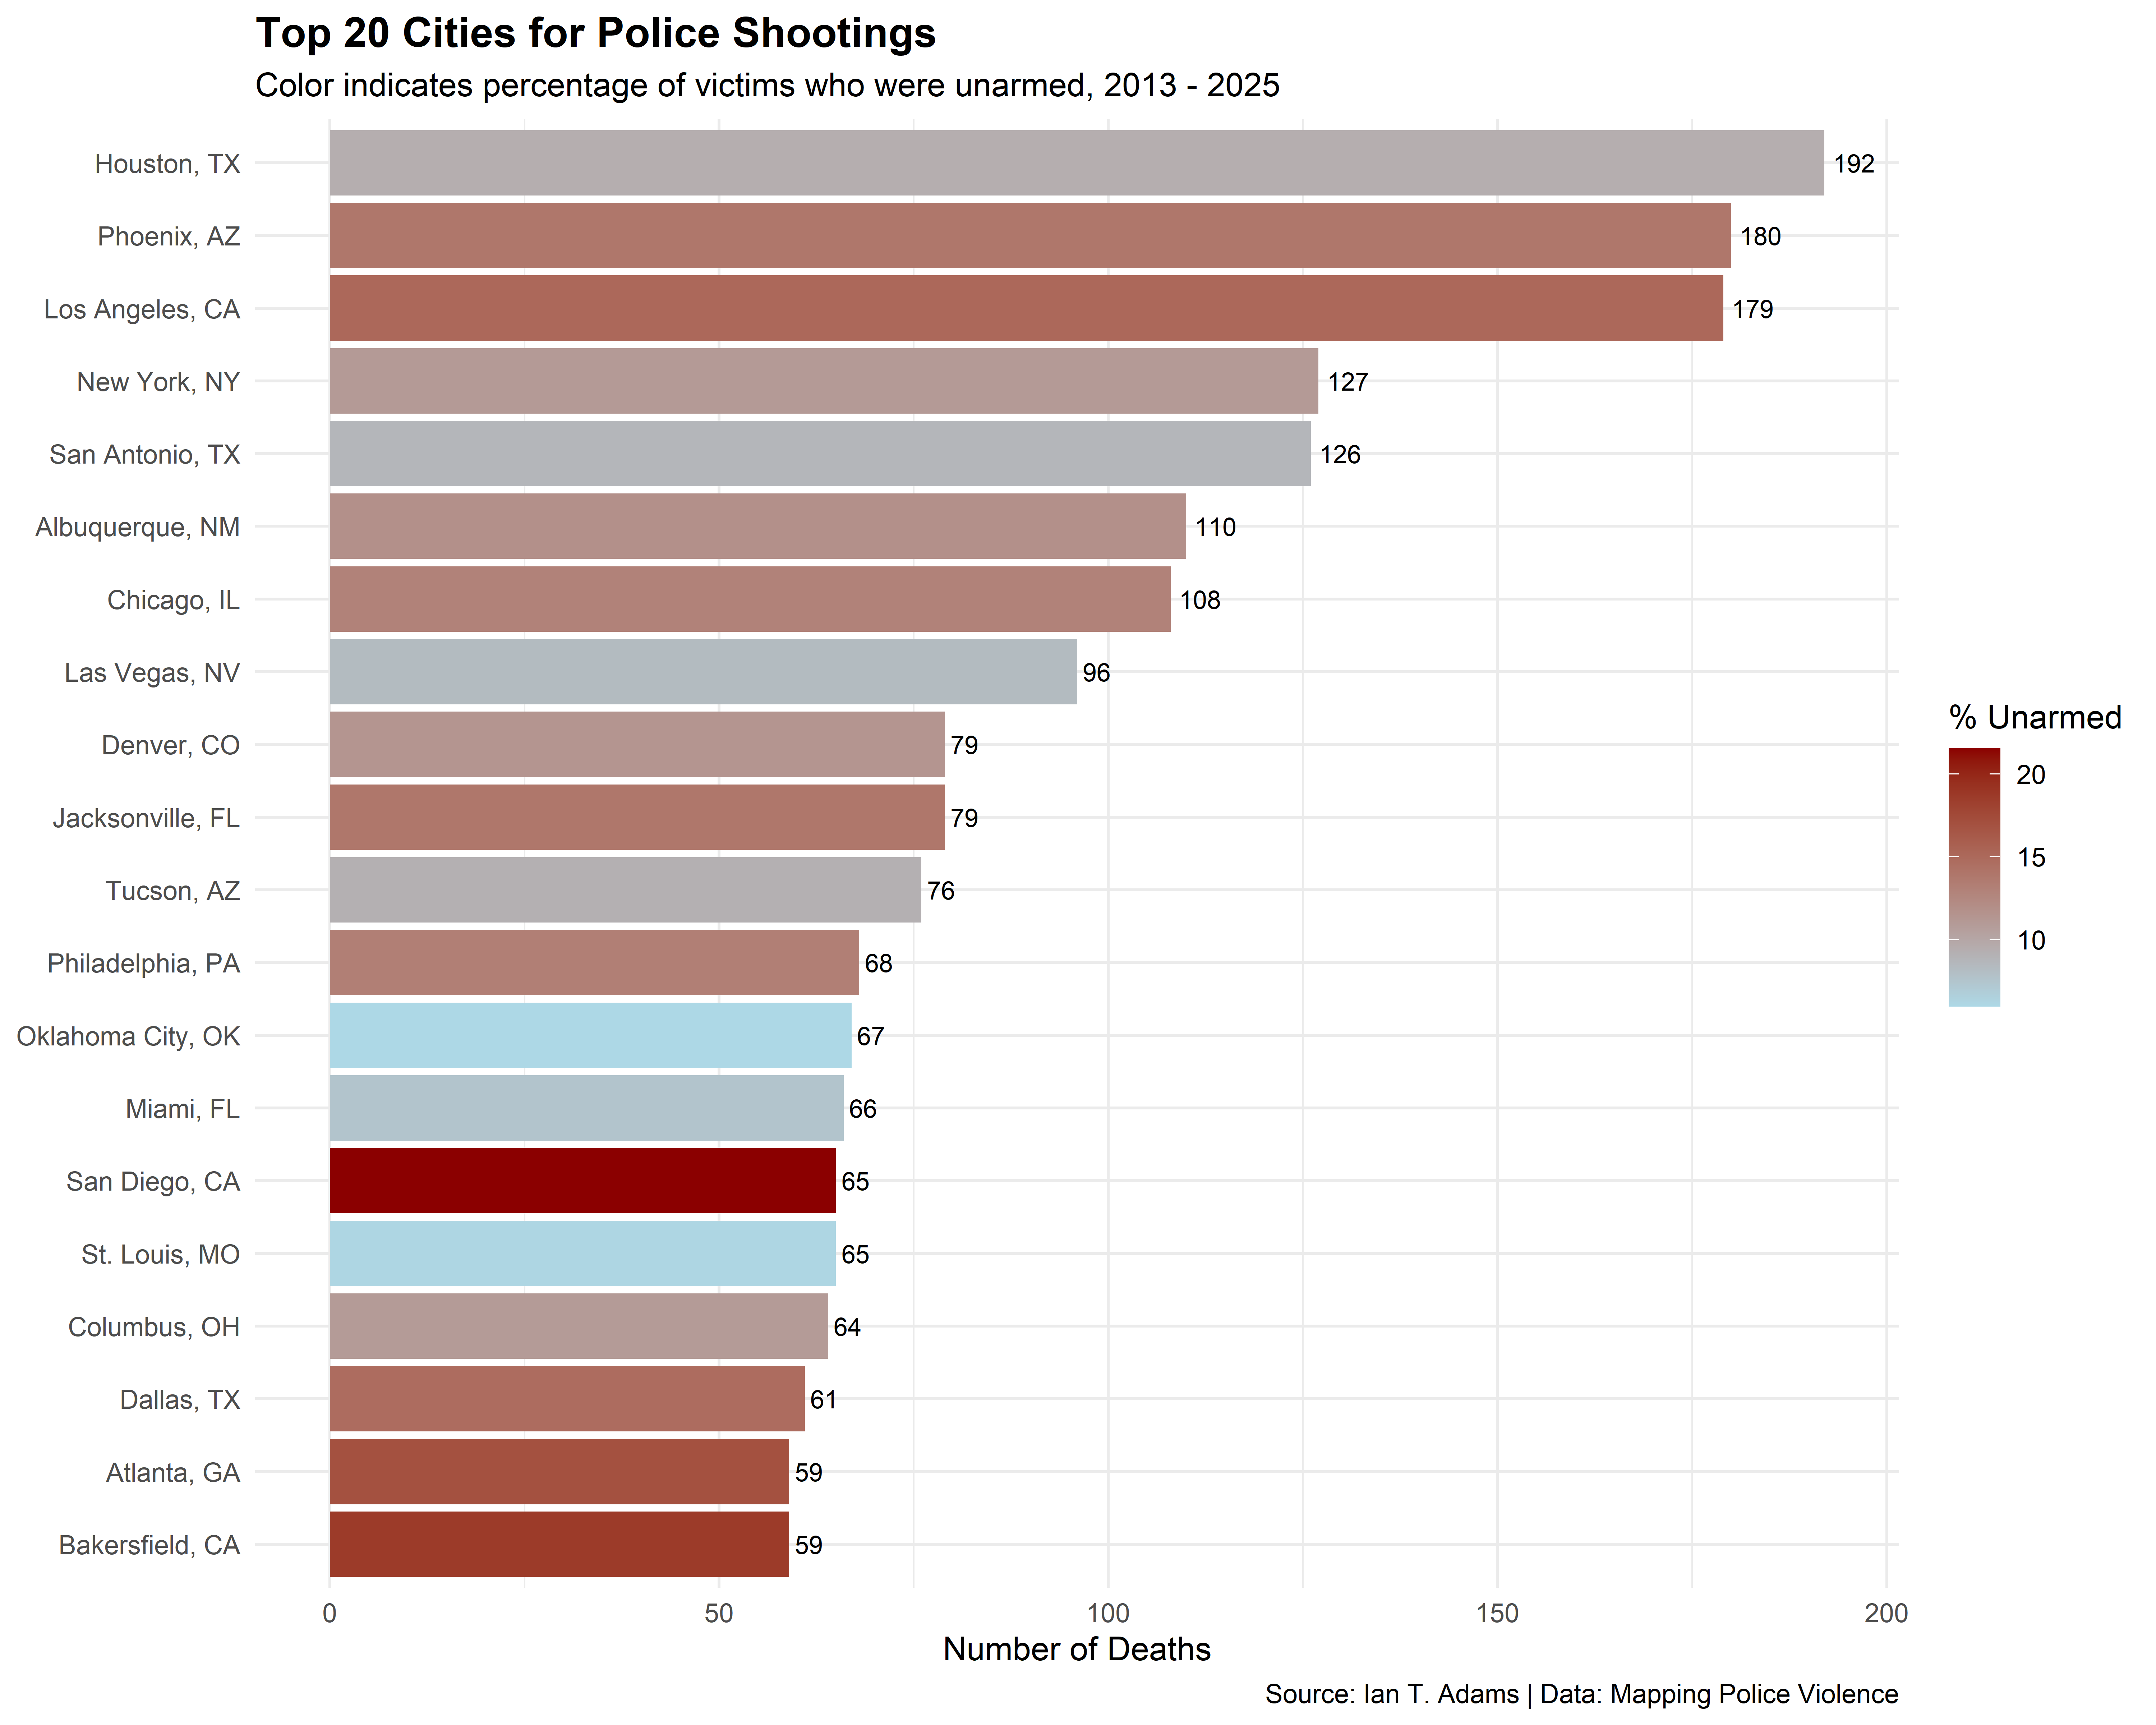
Figure 13: Top 20 cities by number of shootings, colored by percentage of victims who were unarmed
Per Capita Analysis
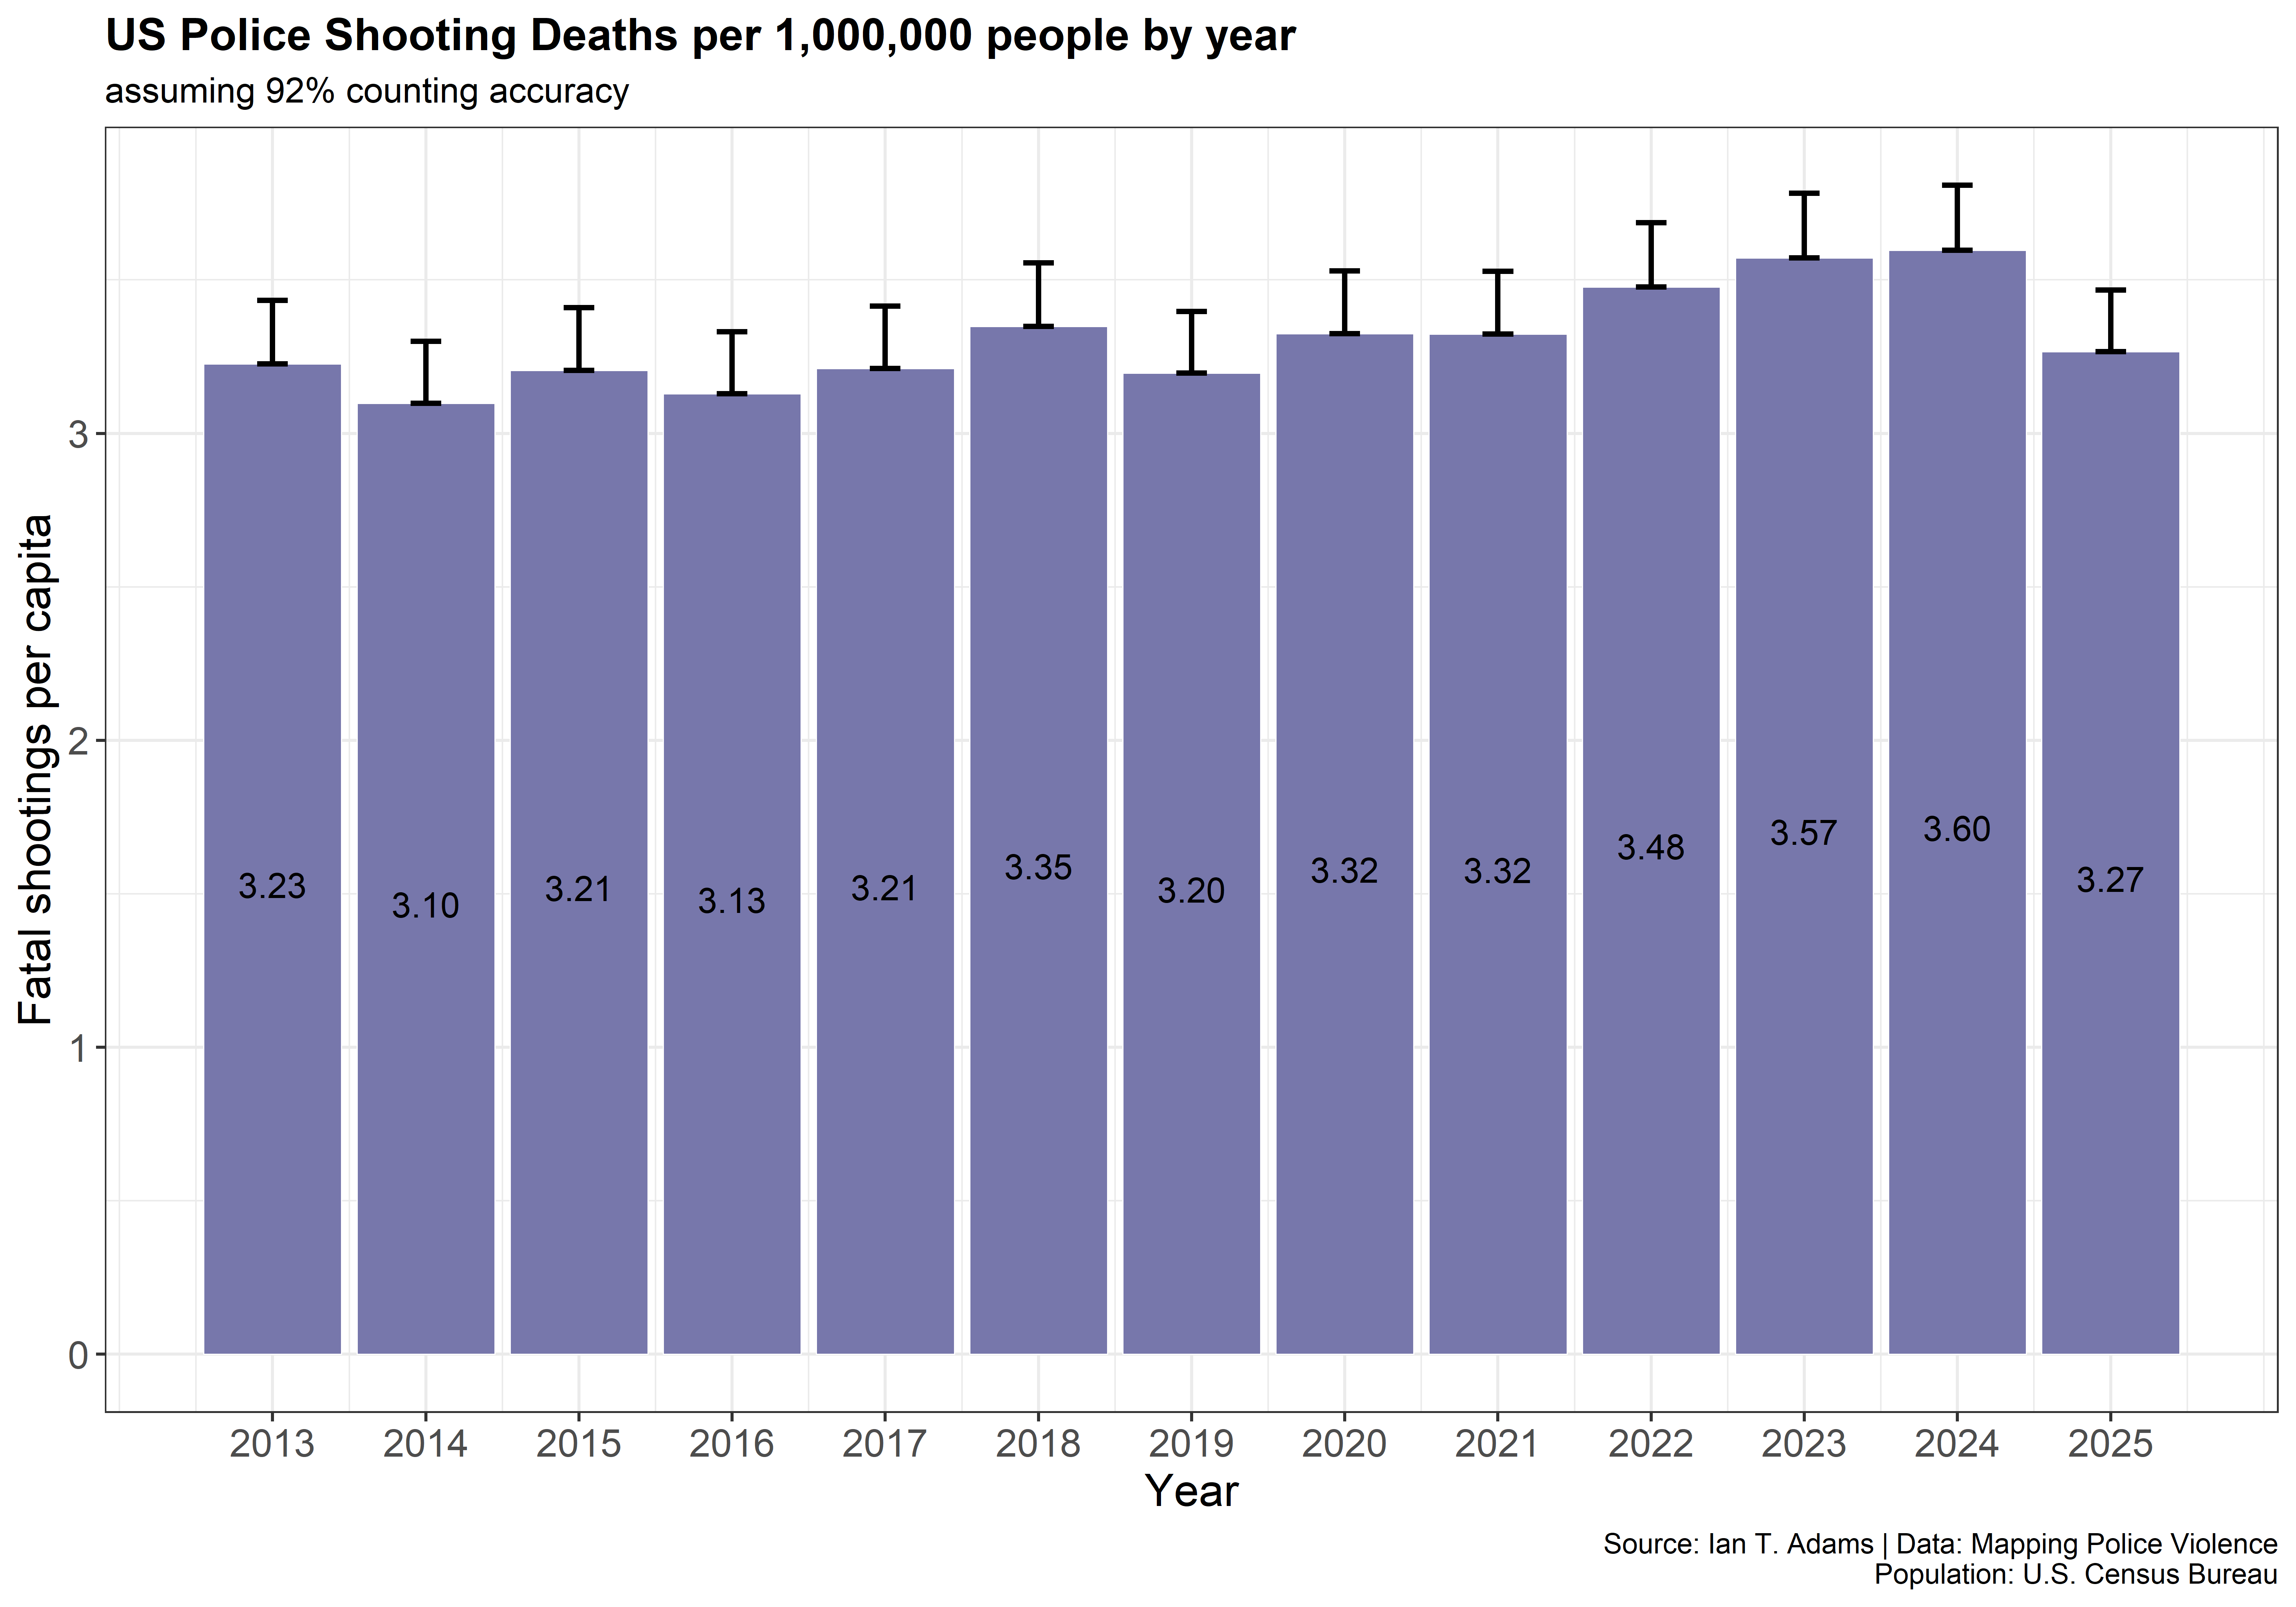
Figure 14: Police shooting deaths per capita by year, with 92% counting accuracy assumption
Accountability and Socioeconomic Context
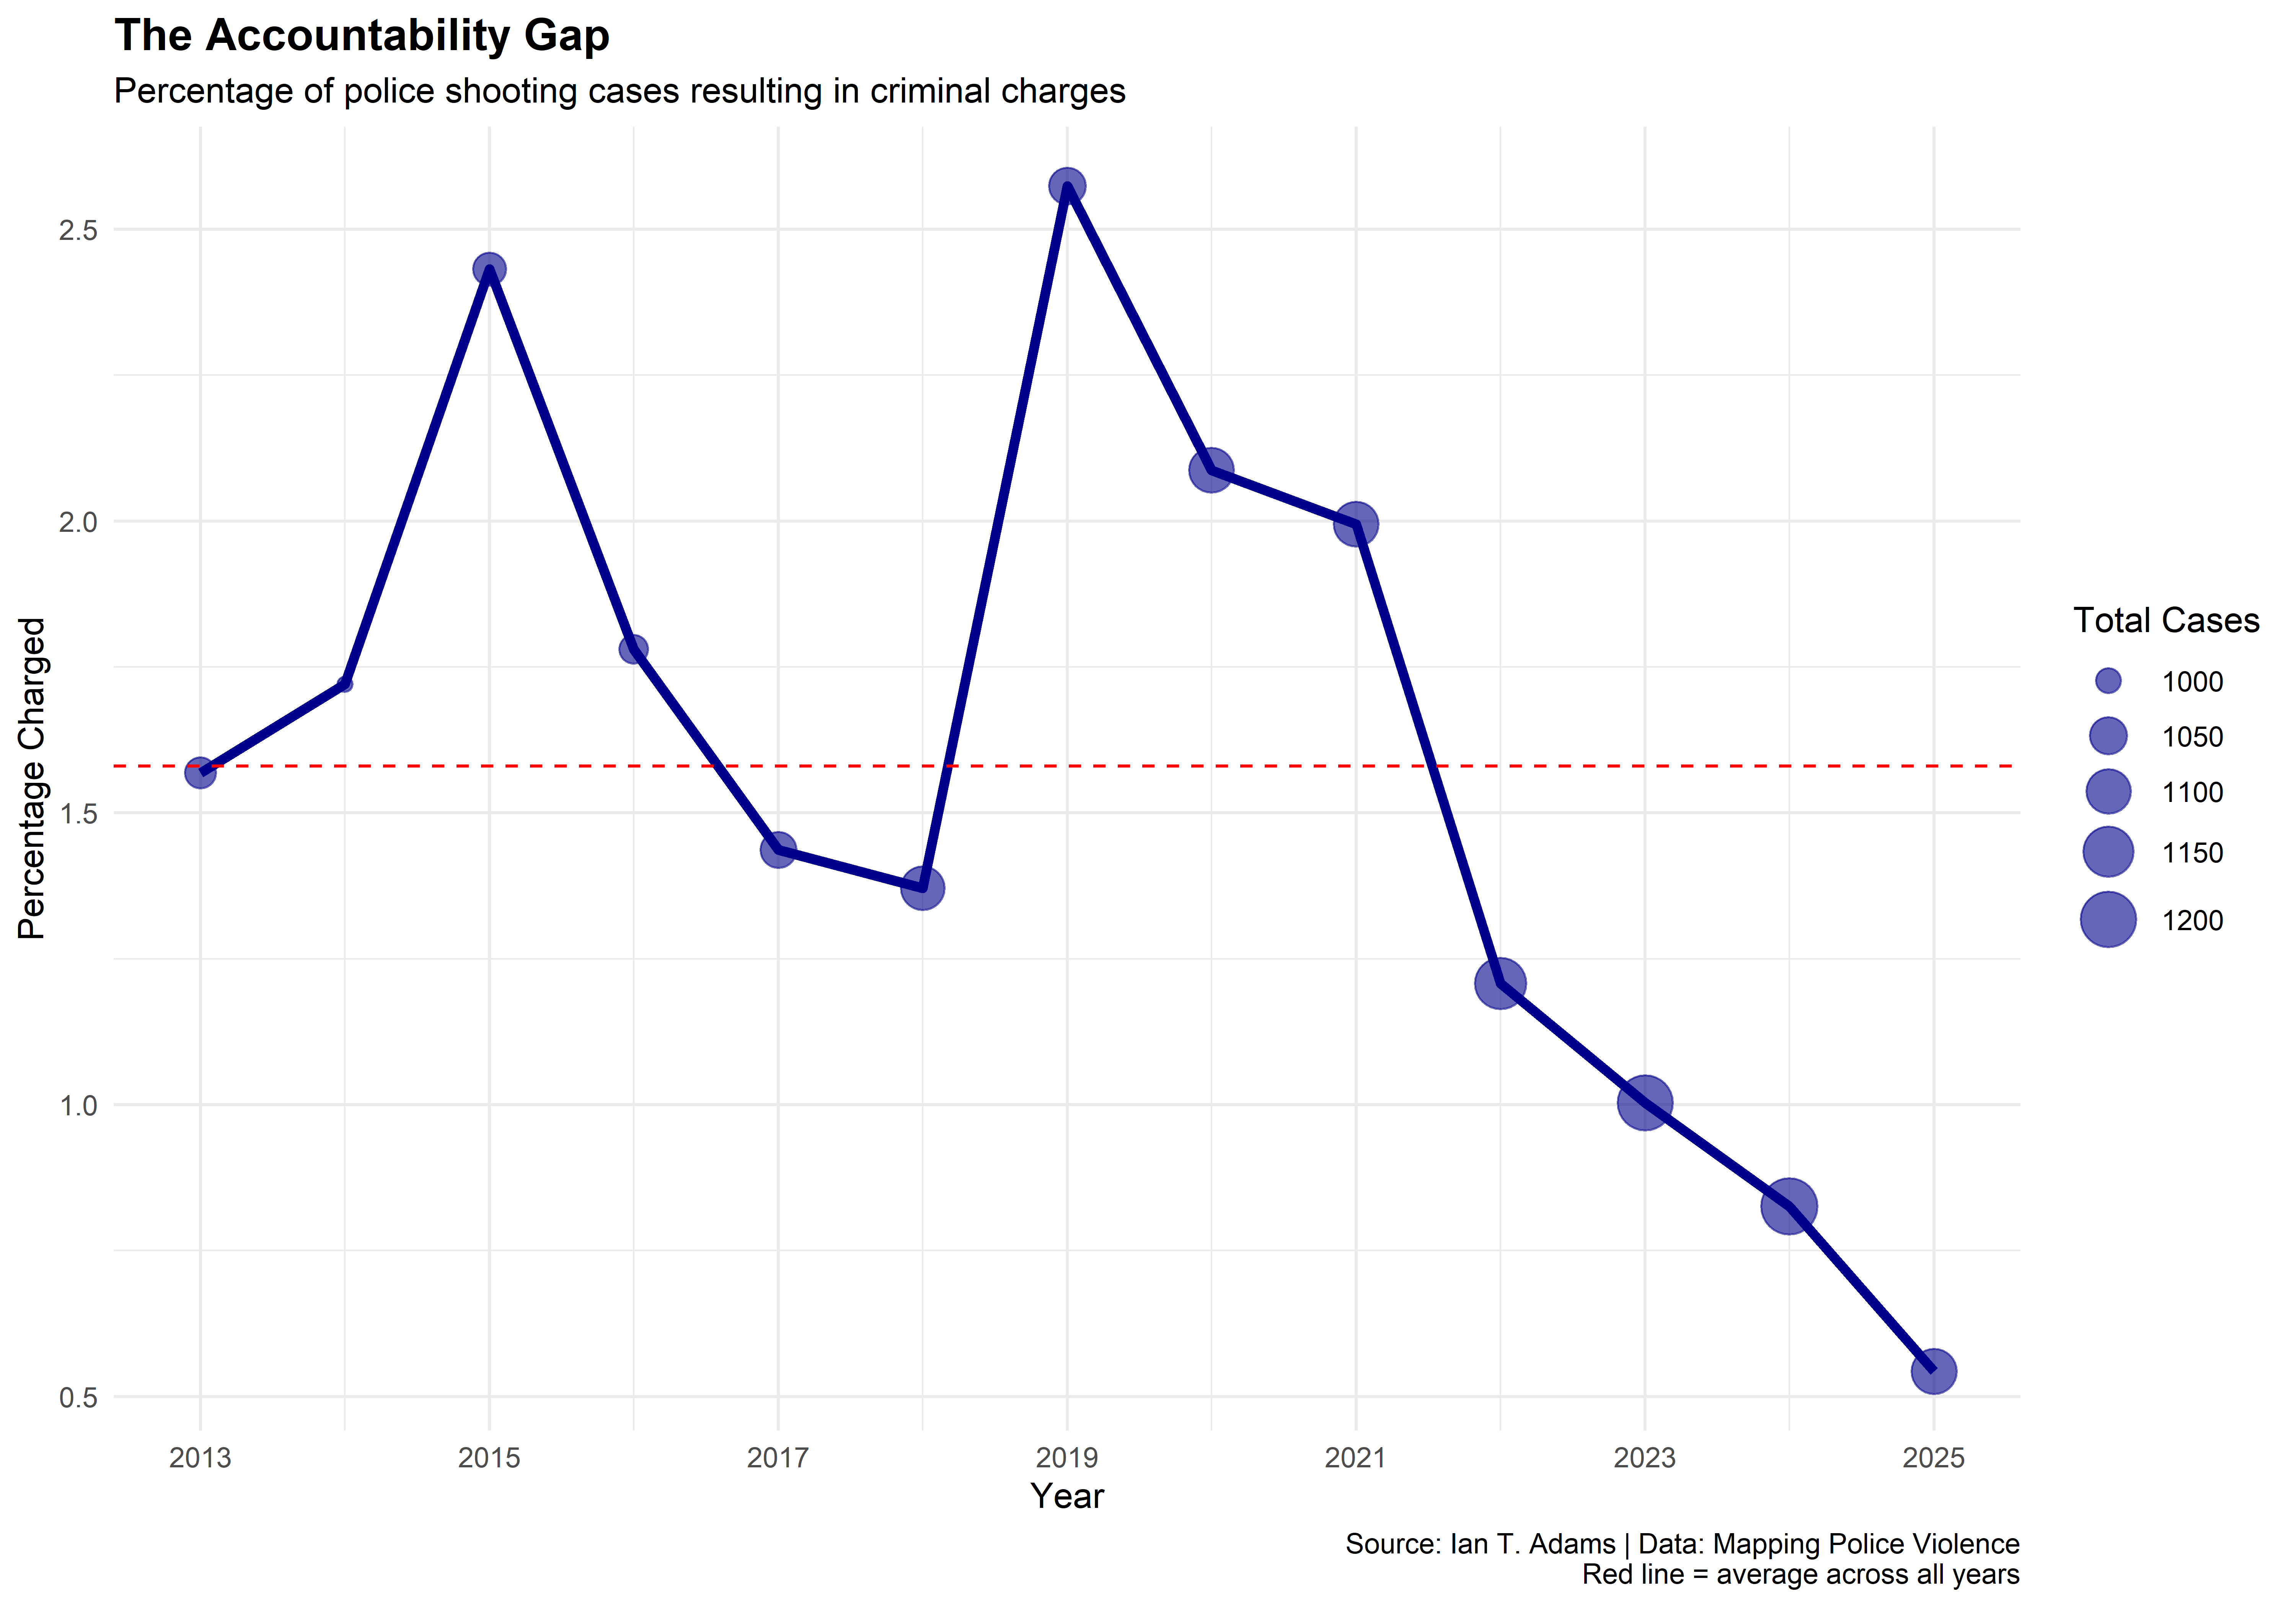
Figure 15: Percentage of police shooting cases resulting in criminal charges
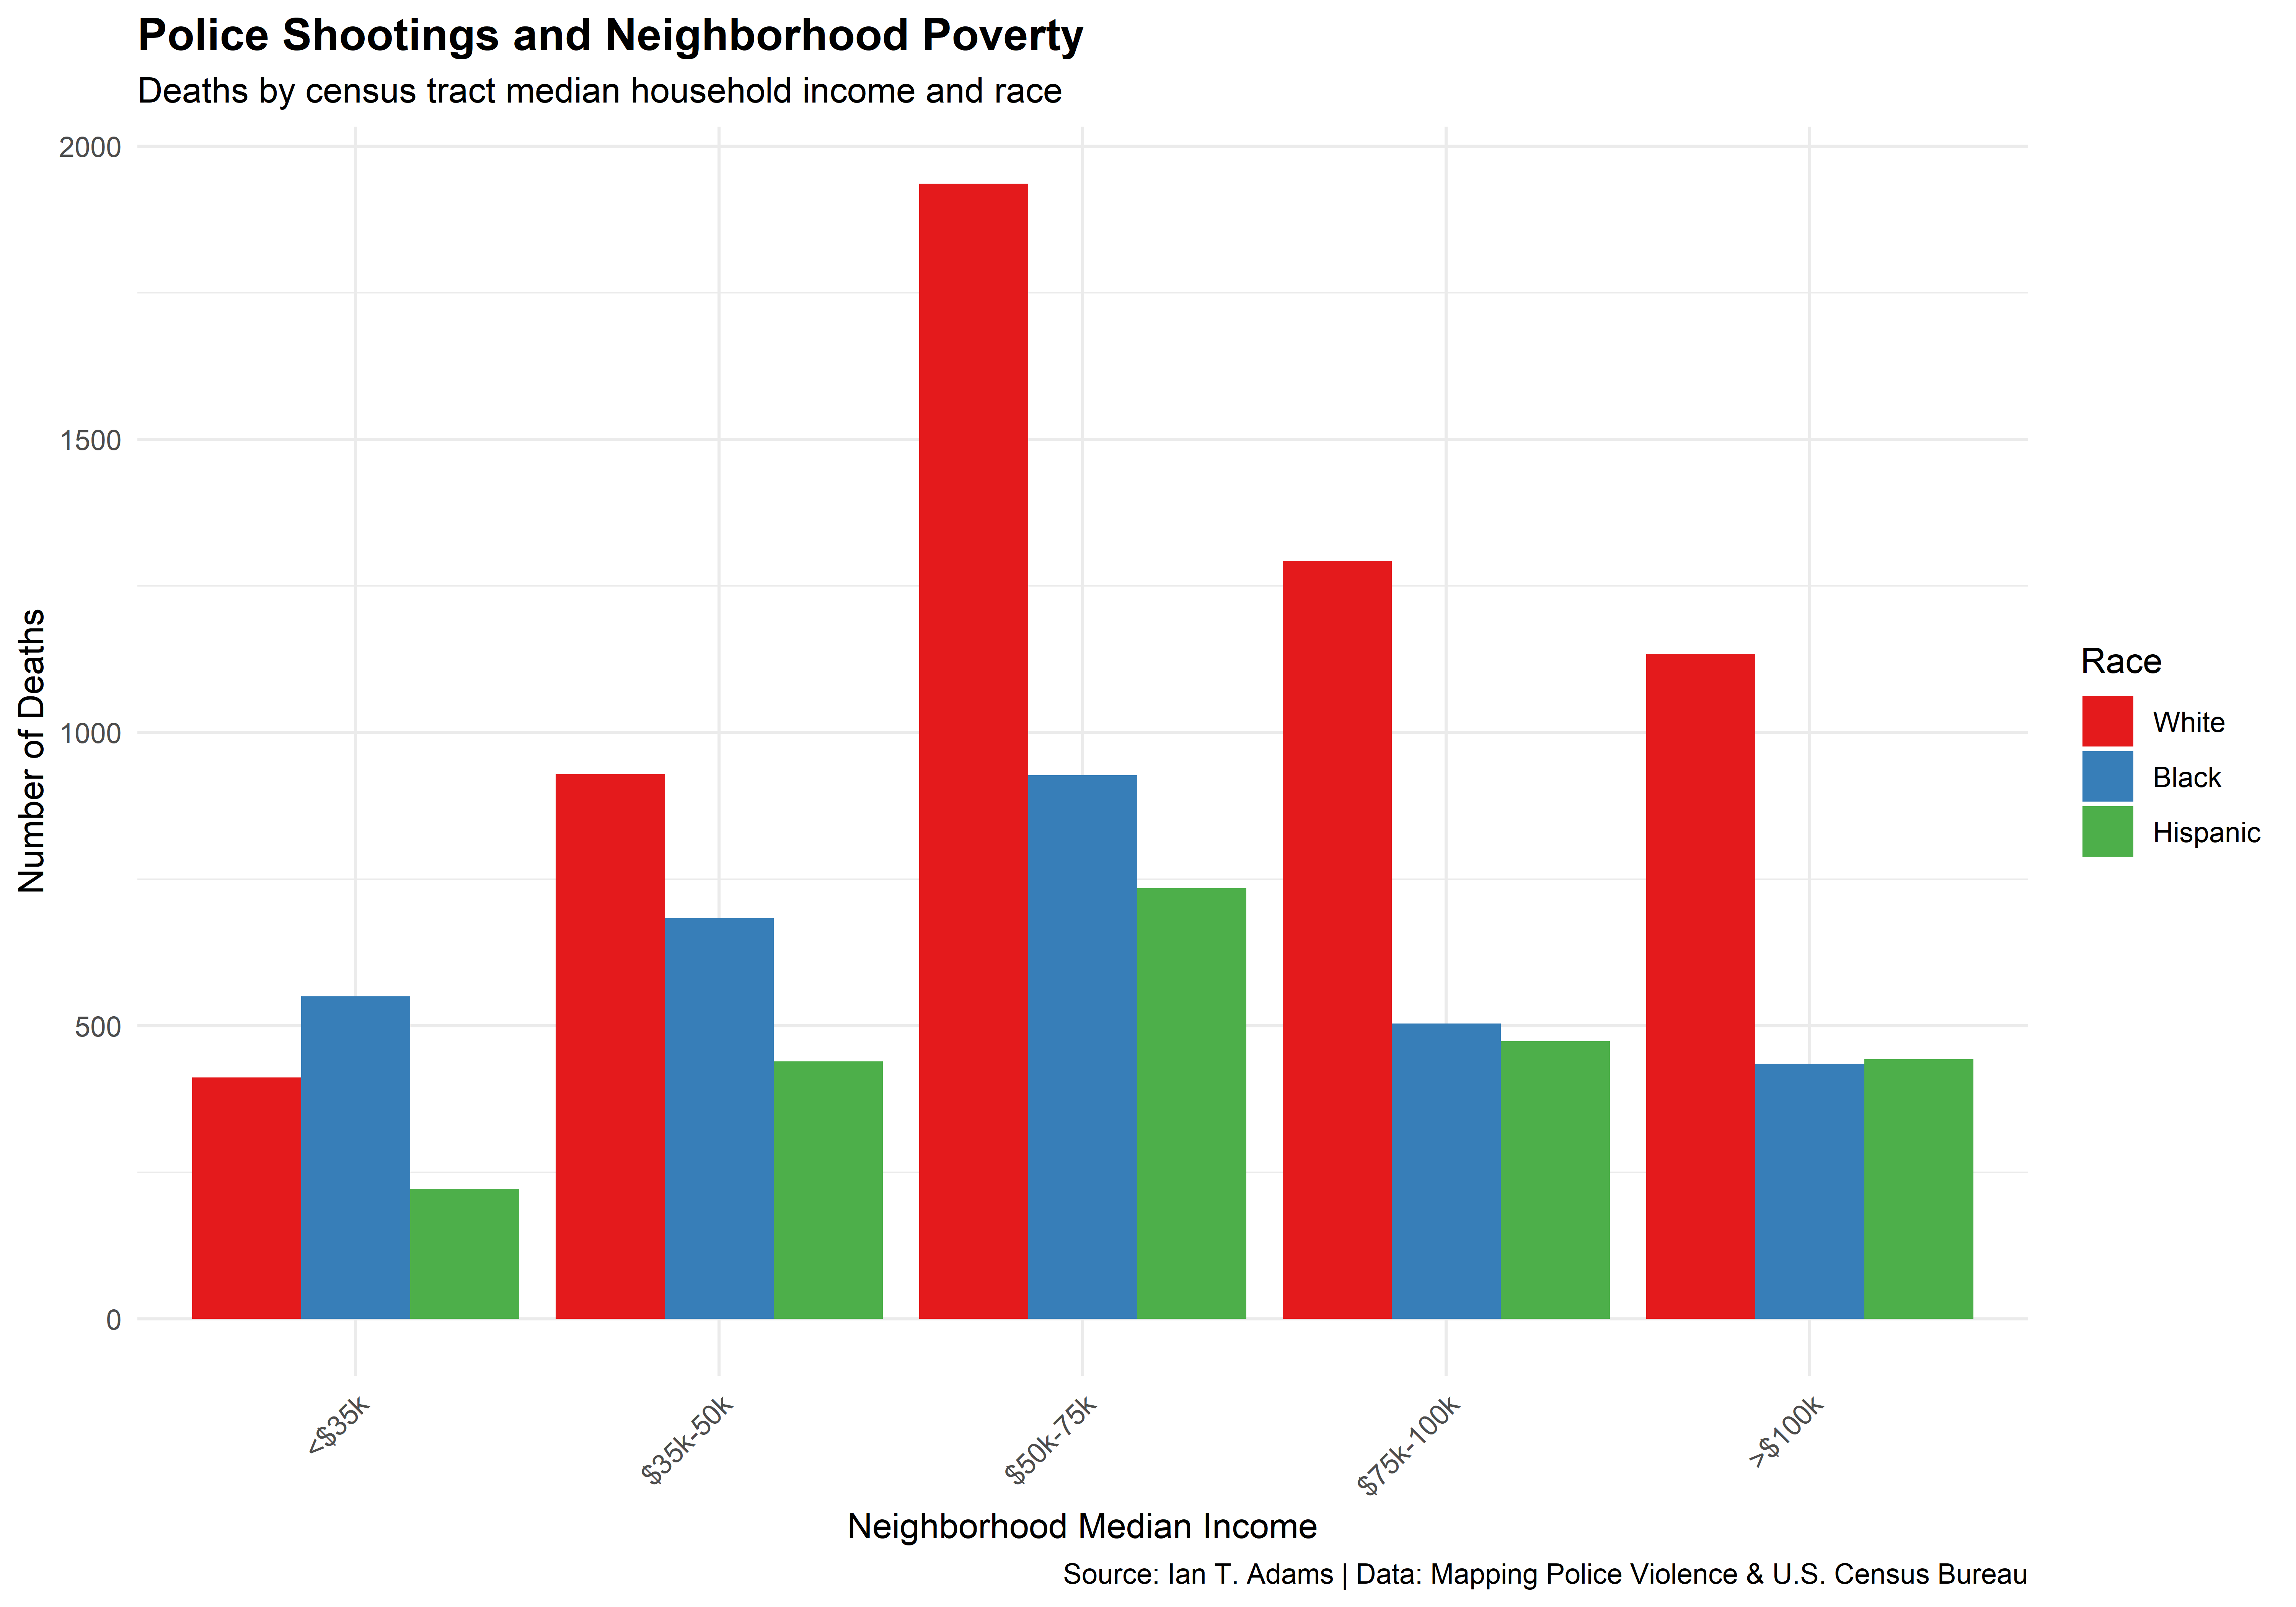
Figure 16: Police shootings by neighborhood median income and race
Data Sources and Methods
Primary Data Source
All data comes from Mapping Police Violence, which aggregates information from:
- Fatal Encounters - A database documenting all deaths through police interaction
- The Washington Post’s Fatal Force database - Tracking fatal police shootings (no longer active)
- Additional cases identified through crowdsourcing and independent research
Update Frequency
This blog post automatically downloads the latest MPV data whenever my website is rebuilt. The database is continuously updated as new incidents are reported and verified.
Important Methodological Considerations
Incomplete Coverage: This data captures police killings only, not all uses of lethal force. Research indicates that a slight majority of police shootings are survived, meaning these statistics undercount total lethal force incidents.
Descriptive Statistics: All analyses presented here are descriptive. Causal interpretation requires controlling for a host of unobserved variables, including but not limited to:
- Local crime rates and patterns
- Police deployment density
- Population demographics
- Socioeconomic factors
- Jurisdictional policies and training
Data Quality: While MPV represents the most comprehensive publicly available database, it relies on media reports and public records, which have gaps and inconsistencies.
Racial Categories: Racial/ethnic categorizations follow the source data and may not capture the full complexity of identity.
Code Availability
The R code for this analysis is embedded in this R Markdown document. The source code is available in the academic-website repository.
Last updated: January 04, 2026
This analysis is provided for research and educational purposes. The data should be interpreted within the broader context of research on policing.
Ian T. Adams, Ph.D.
Assistant Professor, Department of Criminology & Criminal Justice
My research interests center around policing policy, people, behavior, and technology.